
Configuring User Interface Settings
The UI settings impact the Axonius user interface behavior. Configure a range of settings to determine appearance and behavior of the Axonius User Interface.
To open the UI settings:
- From the top right corner of any page, click
 . The System Settings page opens.
- In the Categories/Subcategories pane of the System Settings page, expand GUI, and select UI.
-
Default number of query results displayed per page (default: 20) - Dictates the default number of asset table results displayed per page.
-
When no column sort is applied, sort by count of adapters (default: True)
- Select this option to sort the data by the count of adapters correlating the asset, meaning assets with more adapters are shown at the top of the table.
- Clear this option to sort the asset pages based on the order that the data was retrieved from the database.
-
Perform a query every keypress (default: False)
- Select this option to filter the assets as you write the Query (i.e., the filter expression configured in the Query wizard).
- Clear this option to filter the assets only when you click Search.
-
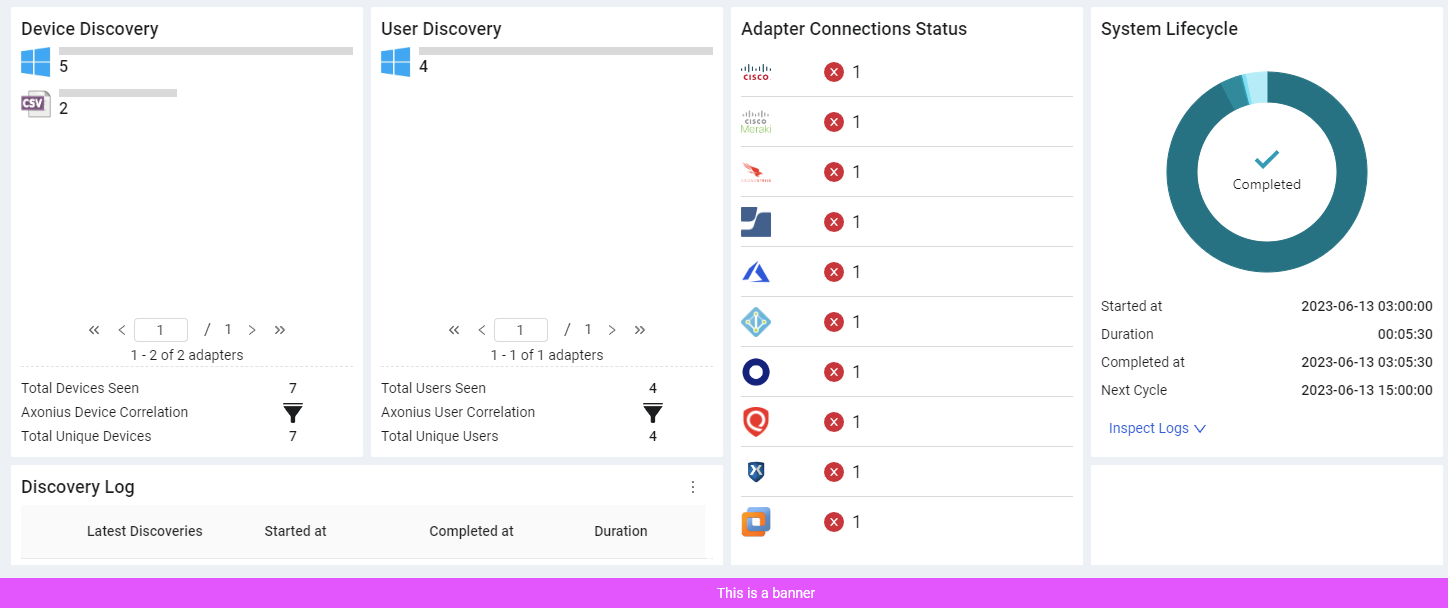
Banner Indication (default: True) - Toggle on to display a banner at the bottom of all system pages with any information that you want all Axonius users to know. If toggled on, the following are enabled and you need to enter values for both:
- Banner text - Type text to appear in the banner.
- Banner color - Use the dropdown color selector to choose a color for the banner. You can choose either a preset color or enter an RGB or Hexadecimal value.
- Set banner expiry date (optional) - Select this option to remove the banner automatically at a set time. When you select it, choose an Expiry date (date and time). The banner is removed at that time. To show the banner again, change the expiry date or clear this option.
After you save the UI settings, the banner is displayed on the bottom of each page in Axonius.
-
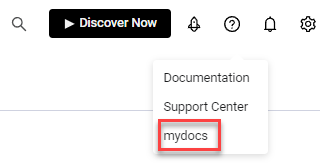
External Link (default: True) - Toggle on to configure a link to an external site. Useful for customers who want users to access a different/additional website. When toggled on, the following are enabled and you need to enter values for both:
-
Menu Label - Type text to appear in the third link that appears when opening the Help and Support menu in the top pane of any Axonius page (see screen below).
-
URL - Type the URL of the external site. Clicking the menu label in the Help and Support menu opens a confirmation screen, and when the user clicks Continue, navigates to the external site at the configured URL.
-
-
Disable in-app announcement pop-ups (default: disabled) - Enable this option to stop Axonius from showing users the pop-up that announces new features when they open Axonius. The setting applies to all users. To change it, you need System Management > Update permission.
- When this option is disabled, users see the pop-up after an upgrade that has new announcements. The pop-up has slides. Use Previous and Next to move between slides, and click Got it to mark the announcements as seen. Closing the pop-up with the close icon hides it for now, and it appears again the next time the user opens Axonius.
- When this option is enabled, no user sees the pop-up, including users who did not see the announcements before. Signed-in users see the change after they reload the page.
- When you disable this option again, users who did not click Got it see the pop-up again.
- This option affects only the new-feature pop-up. Other messages, for example Banner Indication, are not affected.
-
Dashboard Timeline charts - Week start day (default: Sunday) - Set 'Sunday' or 'Monday' as the start of the week for dashboard charts of all Widget types that are displayed as line charts. This setting affects how data is displayed when 'Complete week', 'Complete week to date', or the Week aggregation are selected for viewing results from previous dates in Line charts.
-
Dashboard charts refresh interval (hours) (default: 6) - Select 6, 12, or 24 to set how often Axonius calculates the dashboard charts again in the background. Axonius also calculates the charts again at the end of every discovery cycle, whatever you select. To change this setting, you need the System Management > Update permission.
- With 12 or 24, Axonius skips a periodic refresh when it calculated the charts less than about 12 or 24 hours ago. A discovery cycle that ends also counts as a calculation. With frequent discovery cycles, the periodic refresh can run less often, or not at all.
- A longer interval only lowers the calculation load. The charts never refresh more often than every 6 hours.
- With a larger value, the charts can show older data between discovery cycles. To refresh a dashboard manually, you need the Dashboards > Dashboards > Refresh permission.
- A change of the value takes effect at the next periodic check, with no restart.
- For example, if your system has many large dashboards and runs one discovery cycle each day, select 24. Axonius calculates the charts after the discovery cycle, and the background refresh doesn't run again within 24 hours.
-
Dashboard charts - Apply the saved query's Refine Data (default: True) - Select this option to make dashboard charts count the same data that the asset table of the saved query shows after Refine Data. Clear this option to make the charts ignore Refine Data. To change this setting, you need the System Management > Update permission.
- The setting applies to the Pivot, Field Segmentation, Field Summary, Query Comparison, Query Intersection, Matrix Data, and Query Timeline charts. Only charts whose saved query uses Refine Data change. They change at their next calculation.
- When you save a change of this setting, Axonius calculates the affected charts again in the background.
- When a chart can't apply a part of the Refine Data, it counts the data without it. A notice under the chart says "The Refine Data of the saved query is not applied to this chart", followed by the reason.
- After a Refine Data change, a line chart updates its older dates over the next refreshes, not all at once. Until then, the older dates can show their earlier values.
- See Data Refinement and Field Segmentation Chart.
-
Display decimal accuracy for Pie charts (default: True) - Set this value to not round up the values for pie charts (display the exact value).
-
Enable legacy color palette ordering (default: False) - Select this option to use the legacy color palette.
-
Enable Dashboard's new color palette (default: True) - Select this option to display all dashboards in the updated and more modern color palette.
-
Use exact match for assets search (default: False)
- Select this option to find assets in the Devices/Users page or from the Dashboards page, which are an exact match to the value that you enter in the search bar. Axonius runs the following search logic on the specified value. It is faster than conducting a search for a non-exact match.
- 'Case sensitive exact match' search in any of the selected columns.
- 'Case insensitive words within text' search (any of the words in a string) in the following columns:
- Devices page: Host Name, Network Interfaces: MAC, Device Manufacturer Serial, Last Used Users.
- Users page: User Name, Email.
- Clear this option to use the search bar to find assets in the Devices/Users page or from the Dashboards page that 'contain' the search value in any of the selected columns.
- Select this option to find assets in the Devices/Users page or from the Dashboards page, which are an exact match to the value that you enter in the search bar. Axonius runs the following search logic on the specified value. It is faster than conducting a search for a non-exact match.
-
Require Connection Label on each adapter connection (default: False)
- Select this option to make the Connection Label field mandatory on each adapter connection.
- Clear this option to make the Connection Label field optional on each adapter connection.
-
Require unique connection label for each connection on every adapter - Select this option to require a unique connection label for each connection on every adapter.
-
Require Verify fingerprint field on Linux SSH adapter connections and actions (default: False) - Select this option to make the 'Verify Fingerprint' field a required field on the Linux SSH adapter and Axonius - Run Linux SSH Scan Enforcement Action.
-
Number of values displayed in each column (default: 2) - Select whether asset multivalued fields display a single or two values. If such fields have more values than the selected option, those values can be viewed by hovering over the "+x" indication.
-
Use Tiles view as default view (for supported assets) - Select this option to set the default assets view to Tiles view instead of Table for assets that support this option.
-
Export CSV delimiter to use for multi-value fields (default: empty) - Specify a delimiter to separate between values within the same field of an exported CSV file.
- If supplied, values within the same field are separated by the specified delimiter once the CSV file has been generated.
- If not supplied, values within the same field are separated by "\n" (new line) once the CSV file has been generated.
-
Date format (default: YYYY-MM-DD) - Select the date format to be displayed on all Axonius pages. You can choose between:
- YYYY-MM-DD (for example: 2020-12-31)
- DD-MM-YYYY (for example: 31-12-2020)
- MM-DD-YYYY (for example: 12-31-2020)
-
Custom company logo for reports and email (default: empty) - This setting lets you upload a custom company logo to be used in Reports (PDF files) and emails that are sent by the Enforcement Center. Branding emails with the company logo significantly increases the likelihood that recipients open the emails, as they often question the validity of emails without a company logo and treat them as spam.
- If a logo is uploaded, the created report file / email includes that logo in the header and footer of every page of the report/email.
- If a logo is not uploaded, the created report file / email includes the default Axonius logo.
- The supported formats are: JPG, JPEG, PNG.
- The max file size is 5MB.
-
Custom page header for reports (default: empty) - Enter text that will appear as a header on each page of all generated reports.
-
Report cover pages (default: Display both pages) - Select whether to include:
-
None - No cover pages are included with the report.
-
Cover page only - The report includes only the cover page and not the Table of Contents.
-
Table of Contents only - The report includes only the Table of Contents and not the cover page.
-
Display both pages - The report includes both the cover page and the Table of Contents. When a report has no content, it includes only the cover page.
-
-
Set default Adapters page view as list (default: false) - Select this option to set the default view for the Adapters page to be list view, rather than tiles.
-
Set Adapter Connections column as the first column in Asset Profile page - Select this option to set the Adapter Connection column as the first (on the left-hand) column on the Asset Profile page.
-
Handle adapter fetch event warnings as info events - Select this option to mark new events as Info events rather than Warning events.
-
Fetch asset table row by row (default: enabled) - Select this option to fetch rows from the asset table as they become available instead of waiting for all of the data to be fetched at once.
-
Show Case progress by ticket status (default: false) - Select this option to
Updated 3 days ago