
Monitoring
Use Monitoring to:
- View and manage all Monitoring Rules in your system.
- View a centralized summary of information about each rule in your system, including the source of the rule, the number of alerts it has so far created, and information on the latest alert created by the rule.
- View alerts triggered by each rule originating from Monitoring.
- View system alerts triggered by each rule originating from Enforcement Sets.
- Create new custom rules.
Note
By default, Admin users have access to Monitoring. In order to use this module, Monitoring permissions must be assigned. In addition, View notifications under System Management must be cleared.
Whenever a threshold is crossed, the system sends an alert directly to Monitoring under the rule that triggered it. All alerts can be viewed in Monitoring. You can also use Monitoring to notify teams when a milestone is met or about ongoing remediation efforts.
Monitoring supports all query and entity types - assets and system events (such as adapter fetches and activity logs), enabling you to monitor and manage the Axonius system itself.
To open Monitoring:
-
In the left nav bar, hover over Analysis and select
 Monitoring.
The Monitoring page opens with All Monitoring Rules selected. The All Monitoring Rules page lists all rules found in the system.- If one or more alerts have been triggered since you last visited it, a blue notification dot appears on the Monitoring icon
 in the side menu. This dot is removed once you open the Monitoring page.
 - Rules are organized in the left Category pane.
- If one or more alerts have been triggered since you last visited it, a blue notification dot appears on the Monitoring icon
Rules Table
From the Category pane, you can open the Rules page of any category to see its Rules.
Note
The All Monitoring Rules category opens a table with all rules defined in Axonius.
- When a rule is created, it is added to the bottom of the table in the Findings Center.
- When a rule triggers an alert, it moves to the top row of the table, and a
Newlabel is displayed under its Latest Alert Status. - When you move a rule to Closed status, it moves below those in Open status.
- When you move a rule to In Progress or Canceled status, it moves below those in Closed status.
This means that the Rule table is organized as follows:
- Rules in Open status that triggered alerts are sorted on the top part of the table in descending order of when they triggered their last alert, meaning that the rule that last triggered an alert is on top of the table.
- Rules moved to Closed status appear below those in Open status in descending order of when they triggered their last alert.
- Rules moved to In Progress and Canceled status appear below those in Closed status.
- Rules that did not yet trigger an alert are sorted on the bottom part of the table in ascending order of when they were added to Monitoring. This means that the last rule added to Monitoring, which has not yet triggered an alert, is on the bottom row of the table.
The Rules table provides the following information for each unmuted rule:
- Monitoring Rule Name - The name assigned to the rule.
- Description - The system message that notified about the alert.
- Latest Alert ID - The ID of the latest alert triggered by this rule.
- Latest Alert Status - The status of the latest alert triggered by the rule. Available statuses: Open, In Progress, Closed, Canceled.
- A New label
 indicates that this rule triggered an alert in Open status since the last time you visited the Monitoring page. The rule is bumped to the top of the list.
 - The label is removed when you click the rule to open its details drawer.
- All labels are removed from all rules when you leave the Monitoring page.
- You can manually change the status of the latest alert without having to navigate to the Alerts History page.
- A New label
- Latest Alert Created - The timestamp in UTC of the latest alert triggered by the rule.
- Severity - Severity of the rule. Available options are: Informational, Low, Medium, High, Critical. The severity of an alert is equivalent to the severity of the rule that triggered it. The severity of rules from sources other than Monitoring is fixed per source and is not user configurable.
- Check and Notify - The schedule according to which the rule is configured to check the entity. Relevant for rules originating from Monitoring only.
- Asset Type - The asset type that the rule is configured to check. This is the module selected in the Trigger Condition.
- Source - The source of the rule. For example, Monitoring, Enforcement Center, System. Learn more about the various alert sources.
- Category - The category of the rule.
- Total Alerts - The number of times that the rule checked that the condition exists and created an alert until and including the most recent notification. Alerts created during muting of notifications are only added to the count the next time an alert is created with notification.
Category Pane
The Category pane on the left side of the Monitoring page organizes the rules by category. This organization enables you to easily find related rules.
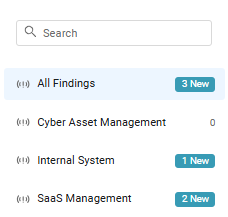
The following are the available rule categories:
- All Monitoring Rules - Includes all rules from all categories. Note that you cannot classify a rule with the All Montoring Rules category.
- Cyber Asset Management - By default, alerts from enforcement actions are accessed through this category.
- Internal System - Alerts from system settings can be accessed from the rule of this category.
- SaaS Management - Visible if SaaS management is enabled.
- Identity Management - Visible if Identity management is enabled.
To the right of each category is displayed either:
-
A New label
if at least one rule in the category triggered new alerts since the last time you visited Monitoring. On the left of each New label, the number of new alerts triggered by rules in that category appears. This is the number of New labels that you see in the Rules table of that category. -
Opening a category with a New label opens the category's rule table with a New label in the Latest Alert Status column of each rule that has new alerts. This ensures that you can identify the rules with new alerts and review them one by one. When you leave the table of a category, the New label is removed from all rule in the table of that category. The label near the category is removed when you open the category's rule page.
-
Labels are removed from all categories when all the specific categories (under All Monitoring Rules) have been opened or you leave Monitoring page.
-
You can search for a category using the Search box at the top of the Category pane.
Rules Retention
The Monitoring page always displays the latest 100,000 rules.
Searching and Filtering
You can filter the rules in the system. You can then use the filters to create queries and also save them as queries, which can be used later on.Read more about queries based on filters.

Note
The filters show only those options that appear in the rules table.
For each filter with a dropdown selection, you can select one or more options.
If you want to filter by many options, you can click Select All to select all options, and then click those options that you want to clear.
The following filters are available:
- Search Monitoring - Enter free text to search for rules by rule name.
- Latest alert status - The status of the latest alert triggered by the rules.
- Severity - The severity of the rule.
- Category - The category of the rule.
- Asset Type - Select one or more asset types on which the rules run. The system returns all relevant rules.
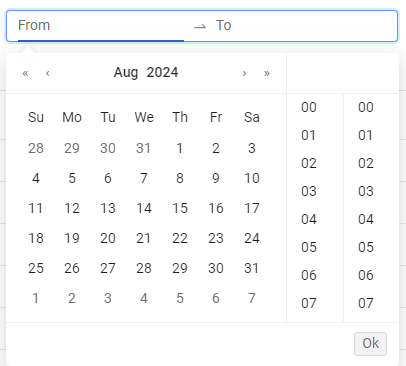
- From - To - Select the period of time for which to display the latest alerts triggered by rules.
- Click From and select the date and optionally the time (right pane) from which to display results. Repeat for To and then click OK.
- Both From and To dates must be filled in and be earlier than or on the current date.
- Click the arrows to the left/right of the Month/Year header to open the previous/next month's or year's calendar page.
- To filter results only for a specific date, select the same date twice.
You can click the following to perform quick actions on filters:
- Select All - Selects all options in a specific filter.
- Clear All - Clears all selections in a specific filter.
- Reset - Clears all filters and displays the entire table.
Performing Actions on Rules
Creating a New Rule
From the Monitoring page, you can create a new rule to check assets of a selected type for specific criteria. The new rule is added to the bottom of the rules table. Learn how to create and configure a new monitoring rule.
Inline Editing the Status of the Latest Alert
In the Rules table, you can use inline editing to manually change the status of the Latest Alert Status of a Finding, without having to open the Rule Details drawer and navigate to its Alerts History page. After you begin actively investigating the cause of the alert, you can manually change the status to In Progress. Then, depending on the results of your investigation, you can change the status to Closed or Canceled. All status changes are logged in the audit log. For example: alert id 123 active_directory_adapter status was changed from Open to In Progress.
To change the status of the latest Alert of a rule
- In the Rules table, hover over the entry in the Latest Alert Status column, and click the Change Status
 icon.
icon. - In the Change Status dialog that opens, from the dropdown, select the new status:
- Open - You viewed the cause of the alert.
- In Progress - You have started investigating the cause of the alert.
- Closed - The problem causing the alert has been solved.
- Canceled - The alert is false positive.
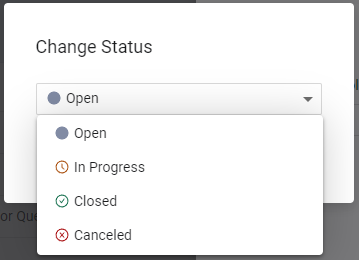
- Click Change Status. The alert moves to below the Open alerts in the table and its alert status changes accordingly.
Creating a Case From a Rule
Directly from the Rules table, you can create a Case based on a rule. Learn how to Create a Case from the Monitoring Page.
Deleting Rules
Directly from the rules table, you can delete one or more rules (Custom). Learn how to delete rules.
Deactivating Rules
Directly from the rules table, you can deactivate one or more rules (Custom). Learn how to deactivate rules.
Duplicating a Rule
You can create a new rule that copies the configuration of an existing one. Duplicating a rule is useful if you want to create a new rule similar to an existing one.
To duplicate a rule
- In the Rules table, do one of the following:
- Hover over the row of a rule, and then at the end of the row, click the Duplicate icon
.png) .
. - Select the checkbox next to a single rule, and then on the top right of the table, click the Duplicate action
.png) .
.
- Hover over the row of a rule, and then at the end of the row, click the Duplicate icon
The 'Make a copy of ' dialog opens. The rule name provided is Copy of . Change the name if you like.
-
Click Create a Copy. The Duplicate Rule drawer opens with all fields and configurations from the original rule populated. Only the name has been changed (with the 'Copy of' prefix).
-
Make any necessary changes to the new rule's configuration, and then click Duplicate. A pop-up notification message informs that the rule was created successfully. The new rule now appears in the rule table.
For general information about working with tables, refer to Working with Tables.
Updated 7 days ago