Viewing Alert Information
- 19 May 2024
- 5 Minutes to read
- Print
- DarkLight
- PDF
Viewing Alert Information
- Updated on 19 May 2024
- 5 Minutes to read
- Print
- DarkLight
- PDF
Article summary
Did you find this summary helpful?
Thank you for your feedback
From the Alerts table, you can click an alert to view its detailed information and attempt to fix the issue that caused the alert.
- Click a Findings Center alert to view detailed information on an alert that originates from the Findings Center.
- Click an Enforcement Center alert to view detailed information on an alert that originates from the Enforcement Center..
Viewing a Findings Center Alert
From the Alerts page, you can view the detailed information of a Findings Center alert. This includes information on the alert and the assets that triggered the alert.
Viewing the Alert Overview
To view alert information
- In the Alerts table, click an alert originating from the Findings Center (Source = Findings Center). The Alert drawer opens with the Overview tab open.

The Alert drawer Overview tab displays the following:
Information on the alert (same as in the Alerts table):
- Severity - The severity of the alert. Equivalent to the severity of the rule that triggered it.
- Date and Time - The date and time in UTC time that the alert was triggered.
- Source - The source of the alert, which is Findings Center.
- Check and Notify - The frequency that the rule checks the entity.
- Status - The status of the alert.
- Mute Status - Muted if the system notified of the alert or Unmuted if the system did not notify of the alert.
Trigger Condition - The configuration of the condition in the rule that triggered this alert.
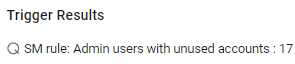
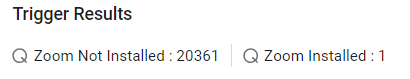
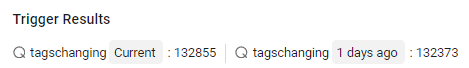
Trigger Results -
For a Simple query threshold trigger condition, displays the name of the query used in the trigger condition and the number of assets that met the condition and created the alert. In this case, under Related Assets, there is a tab with an asset table displaying these assets.
For a Query comparison trigger condition, displays the names of the queries compared and the number of assets resulting from each query, which when compared, met the condition that created the alert. In this case, under Related Assets, there is a tab with an asset table only for the main asset list (the first asset type).
For a Query change over time trigger condition, displays the number of assets that met the condition that created the alert as a result of comparing the query results on the current date to the results on the specified number of days ago. In this case, under Related Assets, there is a tab with an asset table only for the current trigger results. A tag is added for Current and the past (for example: 1 day ago).


Investigating the Cause of a Findings Center Alert
To investigate the cause of a Findings Center alert
- In the Alert drawer, click the Related Assets tab to view the assets that met the Trigger Condition and therefore triggered the alert.
- Open the rule that triggered this alert.
- Attempt to fix the issue that caused the alert.
- Manually update the status of the alert, as relevant.
Viewing Alert Assets
In the Alerts drawer, click the Related Assets tab to view assets related to the alert.

- The table of assets is only available for unmuted alerts.
Note:
When you open the Related Assets tab of a muted alert, the following notification is displayed:

- There is one Asset tab only. For example, Devices.
- When an unmuted alert has no related assets to show, an empty table is displayed.
- In the Assets tab, a table displays the list of assets (the maximum number that fits in the drawer) that crossed the threshold of the trigger condition and therefore created the alert. See the relevant Assets page for a description of the fields in the table (a subset of the fields on the Assets page).
- Under the tab, near Total, is the number of assets related to the alert. If there are more results than can be shown in the drawer, hovering over the info icon displays the tooltip: Showing partial results in drawer.
- Click the Open in Asset Screen link to open the Assets page in a new tab, listing the complete list of assets related to the alert (with all fields).
Note:
If the rule has been modified, the table does not show the assets related to the alerts that were triggered prior to the rule modification. To learn more, refer to the note in Editing a Findings Rule.
Viewing Alert Assets on Assets Page
From the Related Assets tab in the Alerts drawer, click the Open in Asset Screen link to pivot to the relevant Assets page showing the list of assets that triggered the alert. The Assets page opens in a new tab, listing the complete list of assets related to the alert at the date and time that the alert was triggered. See what you can do on an Assets page.

Note:
- Verify that Historical Snapshot Retention Settings are enabled.
- When you pivot to the assets list, it lists the assets that triggered an alert at the time of the alert (based on a historical snapshot from the time of the alert). As assets are constantly added, deleted, and correlated over time in the system, it is possible that some assets that were in the original list may no longer be in the system. Change the date to the current date from the Display by Date field (above figure - enclosed in red rectangle) to view a current up-to-date asset list.
Opening the Triggering Rule
From the Alert drawer, you can open the configuration of the rule that triggered the alert, and also update the rule configuration, if required.
To open the triggering rule
- In the header of the Alert drawer, click the Go to Findings Rule icon
 . The Findings rule that triggered this alert opens.

- Update the rule configuration, if required.
 . The
. The 
Viewing an Enforcement Center Alert
You can view system alerts sent from the Enforcement Center.

To view the source of an Enforcement Center alert
- In the Alerts table, click an alert with Source = Enforcement Center. The Enforcement Set Run History page opens in a new tab, with the drawer of the run that triggered the alert opened. From the Run History drawer, you can open the assets.
- Attempt to fix the cause of the alert.
- Manually update the status of the alert, as relevant.
Was this article helpful?