
Query Timeline Chart
The Query Timeline supports single and multiple queries, displaying the number of results as a trend line over the selected date range.
You can select to display results for a date relative to today or a fixed date range.
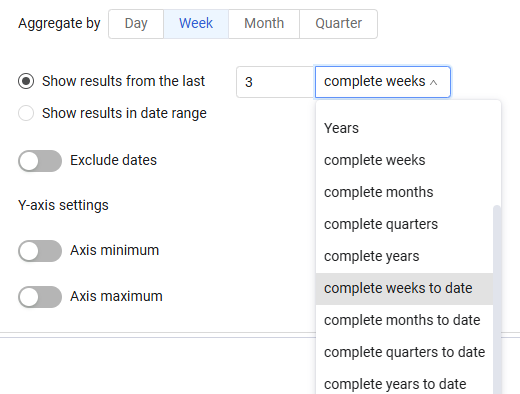
In addition to viewing results from the defined number of selected time periods, you can also select 'complete' periods and 'complete' periods 'to date'. Complete periods of time show data only for periods that are a whole unit. Complete periods to date, show data for whole units of time plus the time that elapsed in the current period.
For example, the 2 'complete weeks', displays data from the past two whole weeks. 2 'complete weeks to date' displays data for the past two whole weeks, plus the days that have elapsed in the current week so far.
NoteTimeline charts may show partial data if historical snapshots are disabled.
To configure a Query Timeline chart:
-
In the Chart title text box, enter a title for the chart.
-
In the Description text box, you can add an optional description.
-
From the Widget dropdown, select Query Timeline Chart.
-
Select the chart mode:
- Comparison - Compare up to six queries. Queries may be existing queries or new ones. Learn more about creating a query.
- Intersection - Intersect a base query and one additional query that intersects with it. When selected, all queries must be from the same asset module, e.g. Users, Devices, Software or Vulnerabilities. Once the asset module is selected for the first query, the module selection list for subsequent queries is automatically matched to the first query.
-
Under Calculate by, select the method of calculation:
-
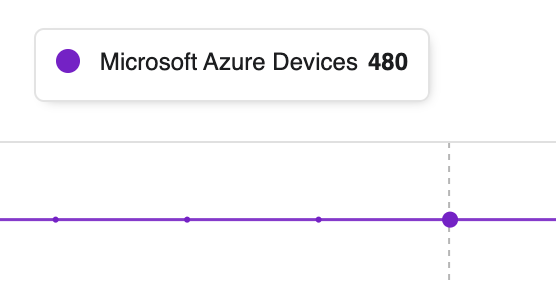
Count - Select to show the actual asset count. The y-axis shows asset count values. When you hover over the value points of the chart lines, the count is displayed in a tooltip.
-
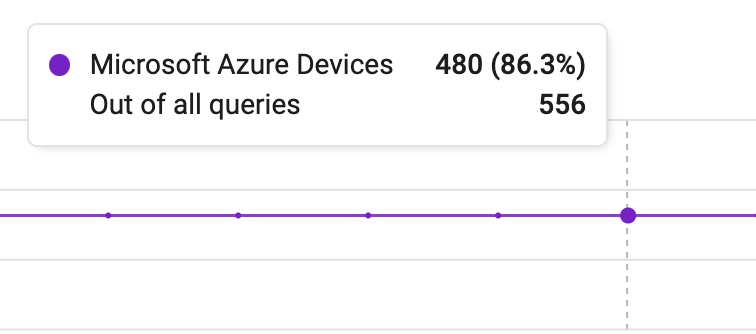
Percent - Select to show the percent of the total asset count of all configured queries. The y-axis shows percentage values. When you hover over the value points of the chart lines, the count is displayed in a tooltip. The top line lists the asset count along with the percentage of the total in parentheses. The second line shows the total number of assets from which the percentage is taken.
-
-
Select an asset module and query for up to 6 queries that can be included in the comparison.
-
In Aggregate by, select an aggregation time period: Day, Week, Month Quarter, or Year. Query results for weekly, monthly, quarterly, and yearly time periods are aggregated based on the average values for the selected time period. Each data point for weekly aggregation is the average of all daily values since the last weekly period. And each data point for the monthly aggregation is the average of all daily values since the last monthly period. You can choose to exclude date ranges from the displayed range. The legend reflects the time period selected.
NoteOn the daily aggregation chart, you can click through to the asset list. See Selecting a Table View for more on what data is displayed when you click a chart segment.
-
Specify the dynamic time period or a date range to be included in the timeline chart. The resulting date range is displayed on the chart that is created.
As you configure the chart, a preview is created in the left pane.
-
(Optional) To exclude dates from the displayed range, click the Exclude Dates slider and select the date range you want to exclude. You can click to exclude multiple date ranges. The preview changes as you select the ranges.
-
In the Y-axis settings section, do the following:
- To set a minimum value, toggle Axis minimum and enter a value in the text box.
- To set a maximum value, toggle Axis maximum and enter a value in the text box.
Note
When the calculation method is Percent, the y-axis minimum is 0 (zero) and the y-axis maximum is 100.
Learn more about setting y-axis values.
-
Click Save.
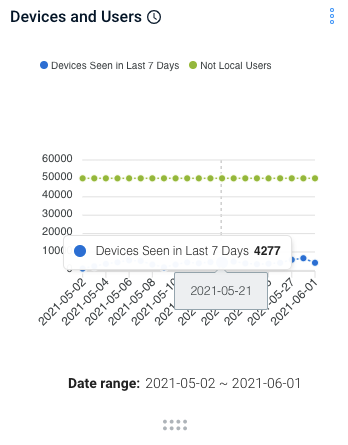
- Once the chart is created, you can hover over data points to see information about them.
- Click on any data point to open the chart in the relevant assets page (depending on the module you chose). See Chart Click-Through to understand what data is shown in the table.
To export the query timeline to a matrix of date and values in a CSV file, select Export to CSV from the chart menu.
Setting Timeline Chart y-axis Min/Max Values
Timeline charts display information as line charts on an x,y grid. Although, by default y-axis minimum and maximum values are set automatically, they can be set manually so that data from different queries that have different value ranges can be displayed properly on one chart.
NoteThe configured minimum and maximum values are used as an approximation and may be adjusted to fit the data properly.
To set y-axis minimum/maximum values
-
Navigate to the dashboard you want and find the chart.
-
Click the More (three dots) menu in the upper-right corner of the chart and select Edit.
-
Scroll down to Y-axis settings and do the following:
- To set a minimum value, toggle Axis minimum and enter a value in the text box.
- To set a maximum value, toggle Axis maximum and enter a value in the text box.
@(Info)(Note:)(When the calculation method is Percent, the y-axis minimum is 0 (zero) and the y-axis maximum is 100.)
Changes are applied immediately and appear in the left pane of the Edit window.
-
Click Save.
Updated 22 days ago