
Viewing Rule Information
From a Rules table, you can do the following:
Viewing a Monitoring Rule
From a Rules table, you can click a rule to open its details drawer. It includes the following tabs:
-
Overview tab -Displays a summary of the rule.
-
Alerts History tab -Lists the rule's triggered alerts.
Viewing the Rule Overview
The Overview tab displays a summary of the selected rule.
To view the overview of a rule:
- In the rules table on the Monitoring page, click a rule originating from Monitoring (Source
=Monitoring). The rule details drawer opens with the Overview tab open.
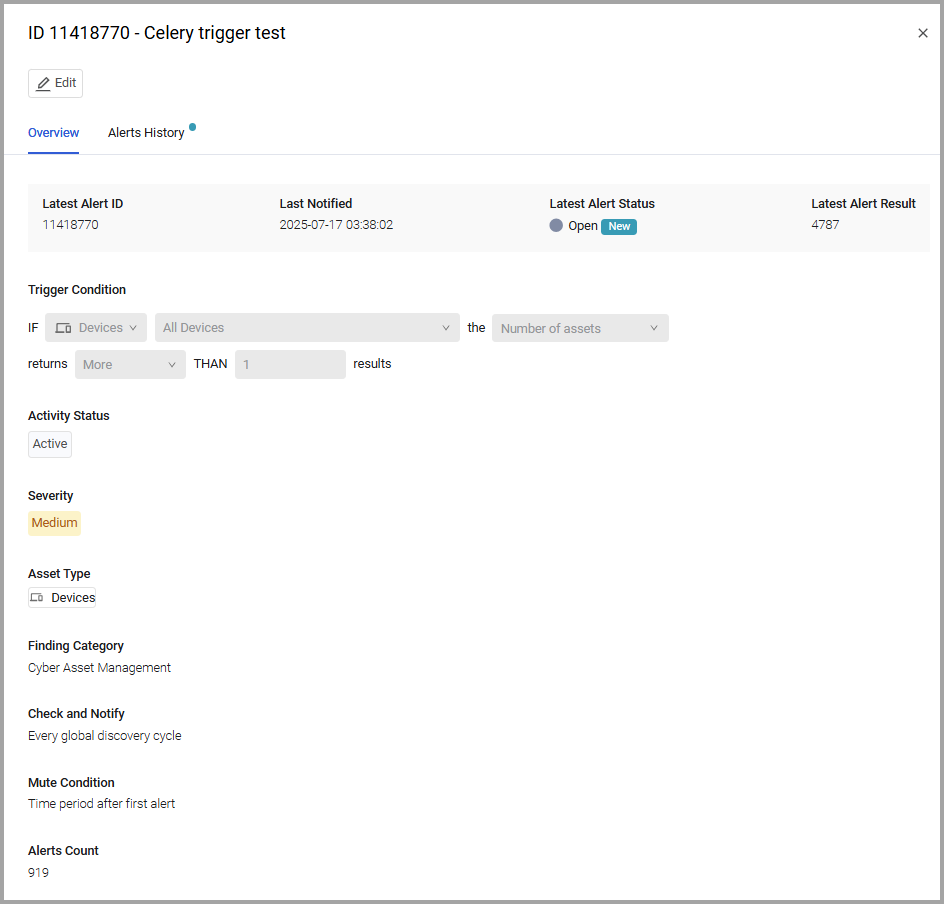
The details drawer Overview tab displays the following:
- Information on the latest alert triggered by the rule (same as in the rules table):
-
Latest Alert ID - The ID of the latest alert triggered by this rule.
-
Last Notified - The timestamp in UTC of the latest not muted alert triggered by the rule.
-
Latest Alert Status - The status of the latest alert triggered by the rule. Available statuses: Open, In Progress, Closed, Canceled.
- A New label
 indicates that the latest alert of this rule was triggered since the last time you visited the Monitoring page. The badge is removed when you leave the rule details drawer. The label appears even if the rule is muted.
- A New label
-
Latest Alert Result - The number of assets related to the latest alert.
-
- Trigger Condition - The configuration of the condition in the rule that triggered this alert.
- Activity Status - The status of the triggering rule.
- Severity - Severity of the rule. Available options are: Informational, Low, Medium, High, Critical. The severity of an alert is equivalent to the severity of the rule that triggered it. The severity of alerts from sources other than Monitoring is fixed per source and is not user-configurable.
- Asset Type - The type of asset being checked by the rule. For example, Devices, Application Settings, Adapters Fetch History,Tickets, Users.
- Finding Category - The category of the rule. For example, Cyber Asset Management, Internal System, SaaS Management.
- Check and Notify - The schedule according to which the rule is configured to check the entity. Relevant for Findings Center Findings only.
- Mute Condition - The time period selected for muting alerts.
- Alerts Count - The number of times that the rule checked that the condition exists and created an alert until and including the most recent notification. Alerts created during muting of notifications are only added to the count the next time an alert is created with notifications.
Viewing the Alerts of a Rule
In the Alerts History tab, you can view all the alerts triggered by a selected rule.
-
From the Alerts History table, you can open a Related Assets drawer that lists the Assets related to the alert, and pivot to their Assets page.
-
After investigating the cause of an alert, you can change the status of the alert directly from the alert row in the Alerts History page.
-
A blue notification dot appears near the Alerts History tab to indicate that there are new alerts for this rule. Once you open the tab, this notification dot disappears.
-
Near each new alert in this tab, including those triggered by a muted Finding, there is a New label
.- The New label remains near the alert until you open the Related Assets or change the Status of the Alert in the Alerts History table, or leave the Alerts History page. The new label shows up even near alerts triggered when the rule is muted.
To view rule Alerts:
- In the rule details drawer, click the Alerts History tab.
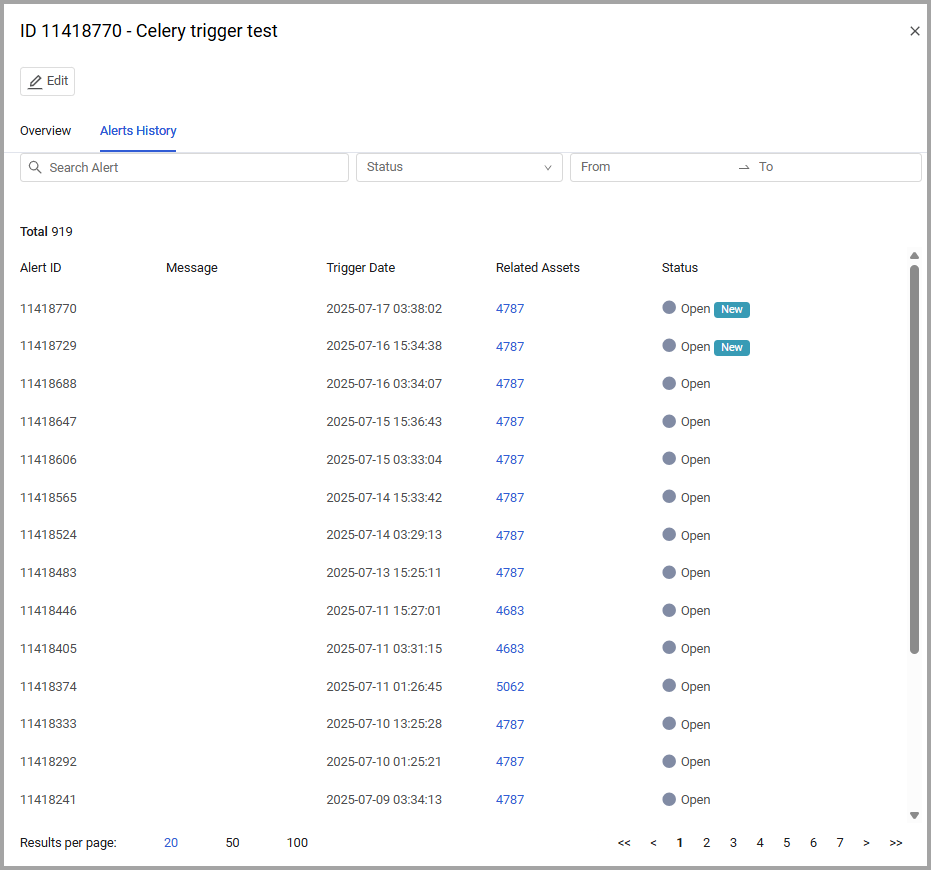
The Alerts History tab includes the following:
- Alert Filter -
- Search Alert - Type free text found in the message of the alerts to display.
- Status - From the dropdown, select the alert statuses to display.
- From, To - Select the period of time for which to display the alerts.
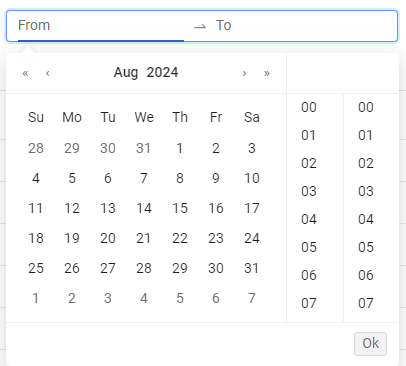
- Click From and select the date and optionally the time (right pane) from which to display results. Repeat for To and then click OK.
- Both From and To dates must be filled in and be earlier than or on the current date.
- Click the arrows to the left/right of the Month/Year header to open the previous/next month's or year's calendar page.
- To filter results only for a specific date, select the same date twice.
- Total - Displays the total number of alerts triggered by the rule.
- Alerts table, with the following information:
- Alert ID - The ID number of the alert. This number is assigned by the system in sequential order.
- Message - The message generated by the alert.
- Trigger Date - The timestamp in UTC that the finding triggered the alert.
- Related Assets - The number of times the rule triggered alerts at the specified date and time.
- Related Assets are relevant only for rules originating from Monitoring.
- Clicking the link in the Related Assets column opens the Related Assets drawer for this alert. This link is clickable only for unmuted rules.
- When you open the related assets of a New alert in this table, the New label is removed from the alert and from the Latest Alert Status column in the rules table.
- Status - The status of the alert. Available statuses: Open, In Progress, Closed, Canceled. You can hover over this field, and from the dropdown that opens, select a new status for this alert, as relevant. The status is also updated in the Findings table under the Latest Alert Status column.
Viewing the Assets Related to the Alert
On the Alerts History page for a rule originating from Monitoring, click the link under the Related Assets column to open the Related Assets drawer, which displays a list of assets that met the Trigger Condition and therefore triggered the alert. 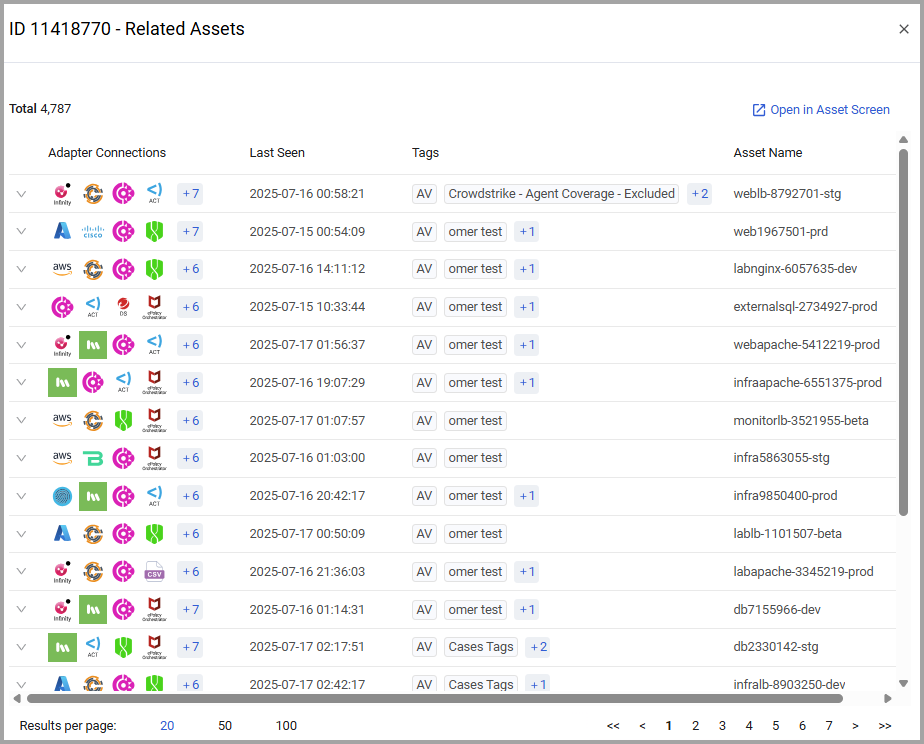
-
Click the arrow at the start of the Related Asset row to show the information per adapter connection.
-
The table of assets is only available for unmuted alerts.
-
For Query Comparison triggers, the alerts of the first query's assets are shown. For example, Devices.
-
When an unmuted alert has no related assets to show, an empty table is displayed.
-
In the Related Assets drawer, the table lists the assets that crossed the trigger condition threshold and therefore triggered the alert. See the documentation of the relevant Assets page for a description of the fields in the table (a subset of the fields on the Assets page).
-
Total (above the table) displays the number of assets from the query (the first query in a Query Comparison trigger) related to the alert.
-
Click the Open in Asset Screen link to open the Assets page in a new tab, where you can view the complete list of assets related to the alert (with all fields).
Note
If the Finding has been modified, the table does not show the assets related to the alerts that were triggered prior to the Finding modification. To learn more, refer to the note in Editing the Custom Finding Configuration.
Viewing Related Assets on Assets Page
From the Related Assets tab in the Alerts drawer, click the Open in Asset Screen link to pivot to the relevant Assets page showing the list of assets that triggered the alert. The Assets page opens in a new tab, listing all assets related to the alert at the date and time the alert was triggered. See what you can do on an Assets page. 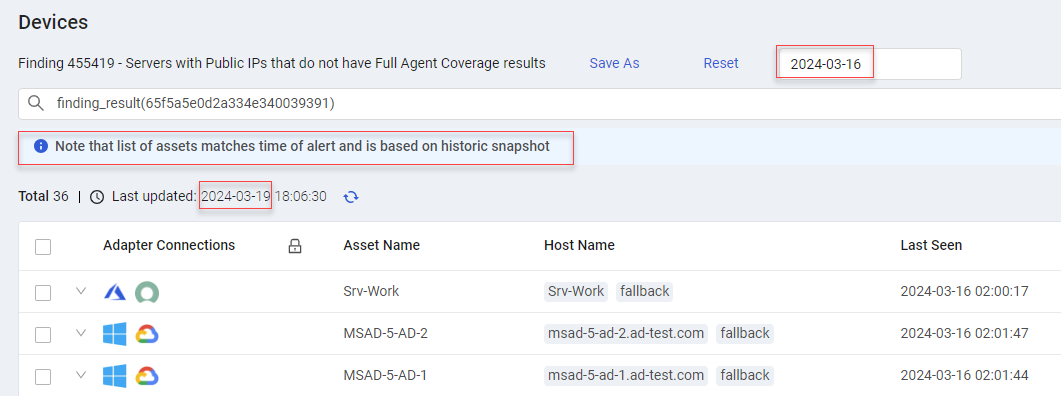
Note
Verify that Historical Snapshot Retention Settings are enabled.
When you pivot to the assets list, it lists the assets that triggered an alert at the time of the alert (based on a historical snapshot from the time of the alert). As assets are constantly added, deleted, and correlated over time in the system, it is possible that some assets that were in the original list may no longer be in the system. Change the date to the current date from the Display by Date field (above figure - enclosed in red rectangle) to view a current up-to-date asset list.
Investigating the Cause of a Monitoring Alert
To investigate the cause of a Monitoring alert:
- In the Alerts History drawer, click the Related Assets link of an Alert to view the assets that met the Trigger Condition and therefore triggered the alert.
- Open the rule that triggered these alerts.
- Attempt to fix the issue that caused the alert.
- Manually update the status of the alert, as relevant.
Viewing an Enforcement Center Rule
From the rule table, you can click a rule to open its details drawer - Alerts History tab. In the Alerts History tab, you can view the alerts triggered by the selected rule that originated from the Enforcement Center. The top row is the current alert, and the rows below it are previous alerts, from the most recent to the earliest.
-
After investigating the cause of an alert, you can change the status of the alert directly from the alert row in the Alerts History page.
-
A blue notification dot appears near the Alerts History tab to indicate that there are new alerts for this rule. Once you open the tab, this notification dot disappears.
-
Near each new alert in this tab, there is a New label
.- The New label remains near the alert until you change the Status of the Alert in the Alerts History table, or leave the Alerts History page.
To view the Finding Alerts
- In the rules table on the Monitoring page, click a Finding originating from the Enforcement Center (Source
=Enforcement Center).
The Finding Info-Alerts History tab opens. .png)
The Alerts History tab includes the following:
- Alert Filter -
- Search Alert - Type free text found in the message of the alerts to display
- Status - From the dropdown, select the alert statuses to display.
- From, To - Select the period of time for which to display the alerts.
- Click From and select the date and optionally the time (right pane) from which to display results. Repeat for To and then click OK.
- Both From and To dates must be filled in and be earlier than or on the current date.
- Click the arrows to the left/right of the Month/Year header to open the previous/next month's or year's calendar page.
- To filter results only for a specific date, select the same date twice.
- Total - Displays the total number of alerts triggered by the Finding.
- Alerts table, with the following information:
- Alert ID - The ID number of the alert. This number is assigned by the system in sequential order.
- Message - The message generated by the alert.
- Trigger Date - The timestamp in UTC that the rule triggered the alert.
- Related Assets - Not relevant.
- Status - The status of the alert. Available statuses: Open, In Progress, Closed, Canceled. You can hover over this field, and from the dropdown that opens, select a new status for this alert, as relevant. The status is also updated in the rules table under the Latest Alert Status column.
Investigating the Cause of an Enforcement Center Alert
To investigate the cause of an Enforcement Center alert:

To view the source of an Enforcement Center alert:
- In the rules table of the Monitoring page, click a Finding originating from the Enforcement Center.
The drawer opens with information on the alerts triggered by the rule.
-
Open the Enforcement Set Run History page of the Enforcement Set referred to in the Message column. From the Run History drawer, you can open the assets.
-
Attempt to fix the cause of the alert.
-
Under the Status column in the drawer, select a new status for this alert, as relevant. The status is updated in the rules table under the Latest Alert Status column.
Updated 6 days ago