Application Settings
Use the Application Settings to see SaaS application settings data retrieved from your Axonius adapters. This allows you to
- See the extent to which the SaaS applications in your organization are configured in compliance with specific security standard
- Understand how individual settings affect compliance with various standards
- Manage misconfigured settings
- Address security risks
- Locate specific settings in an application
- and more...
Click the Assets icon and from the left-pane, select Application Settings.

Overview
The Overview section contains three visual displays of the SaaS applications in your organization. These charts adjust to reflect any query applied to the page.
You can click the Hide Charts icon  to hide the graphs in the Overview section. Click it again to display the graphs.
- The Properly configured vs Misconfigured Settings chart shows the percentage of settings that are properly configured and misconfigured. Select the corresponding check boxes to display data for only properly configured or misconfigured settings. Hover over the chart to see the number of settings represented by each segment.
- The Misconfigured Settings Displayed by Compliance Standard graph shows the number of misconfigured settings for each of the selected standards. Hover over the various bars to see the percentage of settings for each standard.
- The Misconfigured Application Settings by Impact Level graph shows the number of misconfigured settings for each application, segmented by Impact level. Use the check boxes to select which impact levels to display. Hover over the various bars to see the percentage of users for each extension type.

Application Settings Table
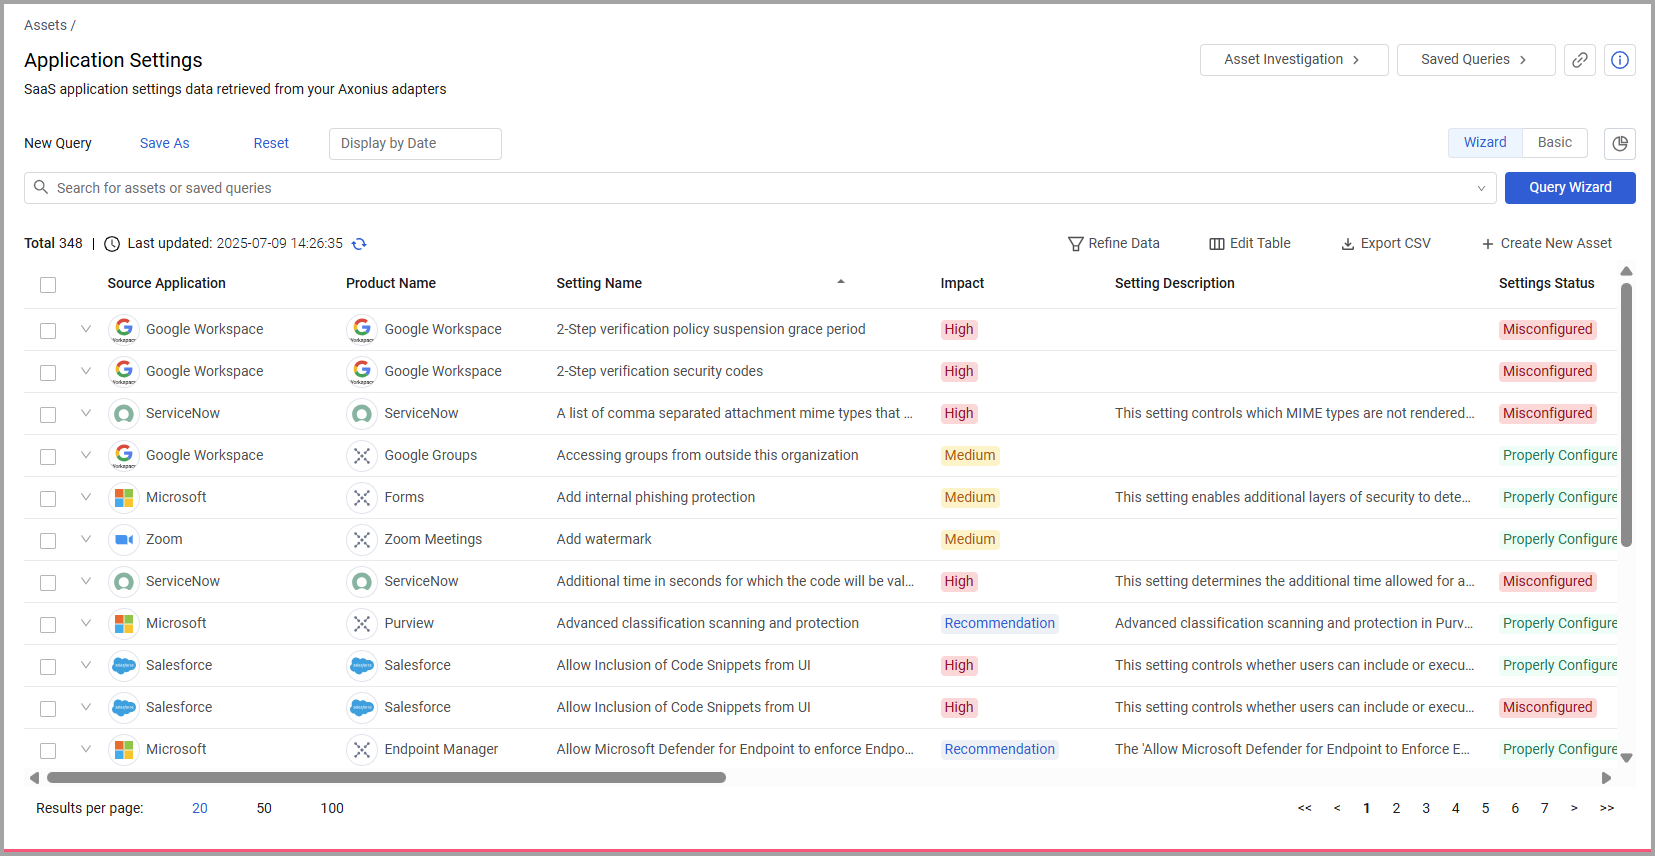
The Application Settings table opens displaying the default view. Not all of the fields are displayed by default. Use Edit Columns to add or remove columns. Each user can customize what fields appear in their own, personalized default view. For more information, see Setting Page Columns Displays.
Click the arrow next to any of the fields to see more details about that field.
Application Settings Fields
There are many fields that you can view and query on the Application Settings page. This includes the following categories of fields:
- Application - Name of the application that the setting is associated with.
- Setting Name - Name of the setting.
- Settings Score - A calculated score based on the validity of all relevant entities for the setting.
- Settings Status - When the value of the settings score equals 1, this field displays a value of "Properly Configured" in green text. When the value of the settings score is less than 1, this field displays a value of "Misconfigured" in red text.
- Level - The entity within the application that the setting relates to (account, group, role, user, etc.).
- Impact - The level of impact a setting has on your organization's security vulnerability.
- Standards - The specific standards or specific sections within a standard.
- Link - Link to the page in the application where the setting is located.
- Product Documentation - Link to the service/product provider documention for the specific setting.
- Configuration Values - List of settings values of all entities (account, roles, groups, users, etc.) that the setting is configured for. This includes entity information, setting value, recommended value, and the value's validity. In the Application Settings page, you can hover over this field to see all the values. On the individual setting's profile page, the values are displayed in a table.
Creating Queries on Application Settings
You can create queries on this page using the Query Wizard or the Basic Query and query fields such as the Level, Impact, Settings Score, and more. You can add additional levels to the query, such as querying by compliance standards and level. Use these queries to find out which settings exist with asset context in your environment or how many applications have a particular settings score. Refer to Creating Queries with the Queries Wizard and how to create Queries in Basic mode to learn more about creating queries.
For example, this query enables you to determine how many high-impact settings in your SaaS environment are misconfigured according to a specific security standard:

After running the query, the overview and table show the queried settings, filtered by the criteria you defined in your query.
Add Tags to Application Settings
Use tags to assign context to your settings for granular filters and queries. Apply new or existing tags to the selected settings. For example, you can tag a setting for your won custom standard, settings that shouldn't be tracked, and more. The list of selected tags is applied to all selected settings.
Refer to Working with Tags to learn about adding tags to settings.
View an Application Setting Profile
You can click on an individual setting asset to see all the data for that particular setting. For more information, see Asset Profile Page.
The details provided in the individual settings profile include a link to change the setting in its application, a link to the documentation for the setting for more information, relevant entities for that setting, relevant standards and other fields that allow you to examine the data for that setting.
Updated 7 months ago
