Viewing Query History
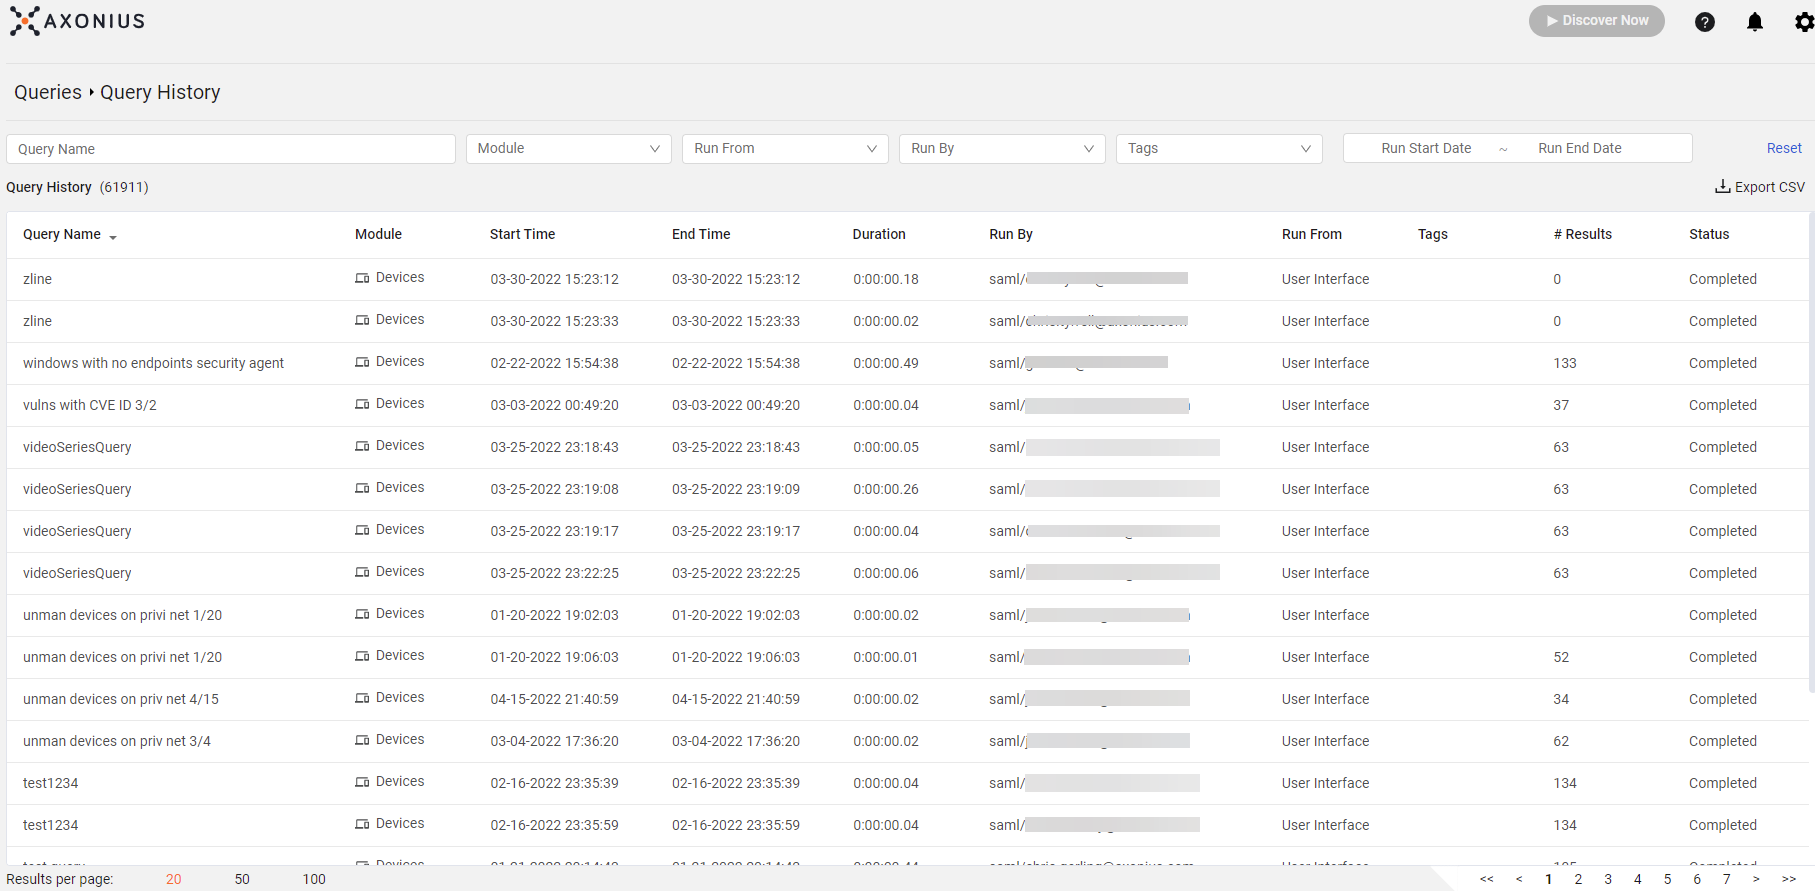
From the Queries page, click Query History to open the Query History page, or right-click on Query History to open it in a new tab. The Query History page shows information about queries the users run on the system. It also allows you to open the query in the Query Drawer to see details about the query. It doesn't show automatic processes that run queries, such as the Dashboard or the Action Center. Click on a query to open the Query Drawer to see all query details. Click Run Query to run a query. To edit a query, open the query from the Saved Queries page.

The following information is displayed:
-
Query Name – The name of the query. For saved queries, the name under which it was saved. For queries that were not saved, the query name is displayed as 'Unsaved query'.
-
Module - Shows in which module the query appears.
-
Start Time – The time it started to run.
-
End Time – The time it finished running.
-
Duration - The time it took the query to run.
-
Run By - The name of the user who ran the query: The username is displayed with a prefix:
- Internal - A user defined internally in Axonius by one of the system admins.
- SAML or LDAP - A user who logged in using the LDAP or SAML based login options.
-
Run From – The way the query was run. The following options can appear:
- User Interface - Run from the one of the pages in the web UI. For example: Users, Devices.
- User Interface - Export CSV - CSV Export run from one of the pages in the web interface.
- API - Run using API.
- API- Export CSV – CSV Export run using API.
Note
When the query involves exporting a CSV, in this case the start and end time are the time it took to export the CSV
-
Source IP - This is the IP address that ran this query.
-
Tags – Tags which are applied to the query.
-
# Results - The number of assets (aggregated assets) returned from the query. For Export CSV this is the number returned when exporting the CSV. For instance, if you choose Split by asset entity in Export CSV or limit the number of rows for the CSV there will be a different number of results than in the original query.
-
Status – The status of the query. The following statuses are available:
- In Progress – the query is still being run.
- Completed – the query finished running.
- Cancelled – the query was cancelled by running another query before it finished running.
- Failed – the query failed to run because there was a failure in the system.
Filtering Queries
Use the Filter at the top of the page to filter the list of users displayed.

-
Query Name - Choose a Query name from the drop down list of queries.
-
Module - The system modules on which the query runs, such as: Devices, Users, etc.
-
Run From - Select from the dropdown.
-
Run By - Select User names from the dropdown.
-
Tags - Choose Tags from the dropdown. This can help locate queries by tags.
-
Run Start Date
-Run End Date - You can filter for a specific run date by clicking the date range picker filter.- Select two dates to set the date range for which queries run will be displayed.
- To filter activity logs only for a specific date, select the same date twice.
- Click Select Time in the date range picker to include specific times in the date range.
- Click OK to set the date range filter.
.png)
-
Use 'Clear all' to clear all of your selections in a specific filter.
Click Reset to clear the filters.
Click Export CSV to export the list to CSV format. The CSV file includes all the columns and their content. If you filter the Query History page, then only the filtered data is exported. The default name of the CSV file is axonius_query_history_logs_date_timeUTC.csv
For general information about working with tables, refer to Working with Tables.
Restoring Query Versions
For each saved query, you can view and restore earlier versions of it. This is useful in the following scenarios:
- Recovering from accidentally modified or broken queries.
- Understanding what changed in the query, when, and by whom, to enhance transparency and information sharing.
- Maintaining an audit trail for query logic evolution.
By restoring a query to an earlier version, you can:
- Avoid time-consuming, error-prone manual recovery procedures.
- Reduce the number of duplicated queries created as backups.
- Ensure safer query reuse across the organization.
When Restoring a query to an earlier version, the restored version automatically propagates to all modules where the query is used: Dashboards, Reports, Enforcement Actions, and more.
Changes to the following query components trigger the creation of a new version:
- Table view (columns)
- Data refinements'
- Query expressions
- AQL
- Query tags
To access earlier versions of a selected saved query:
-
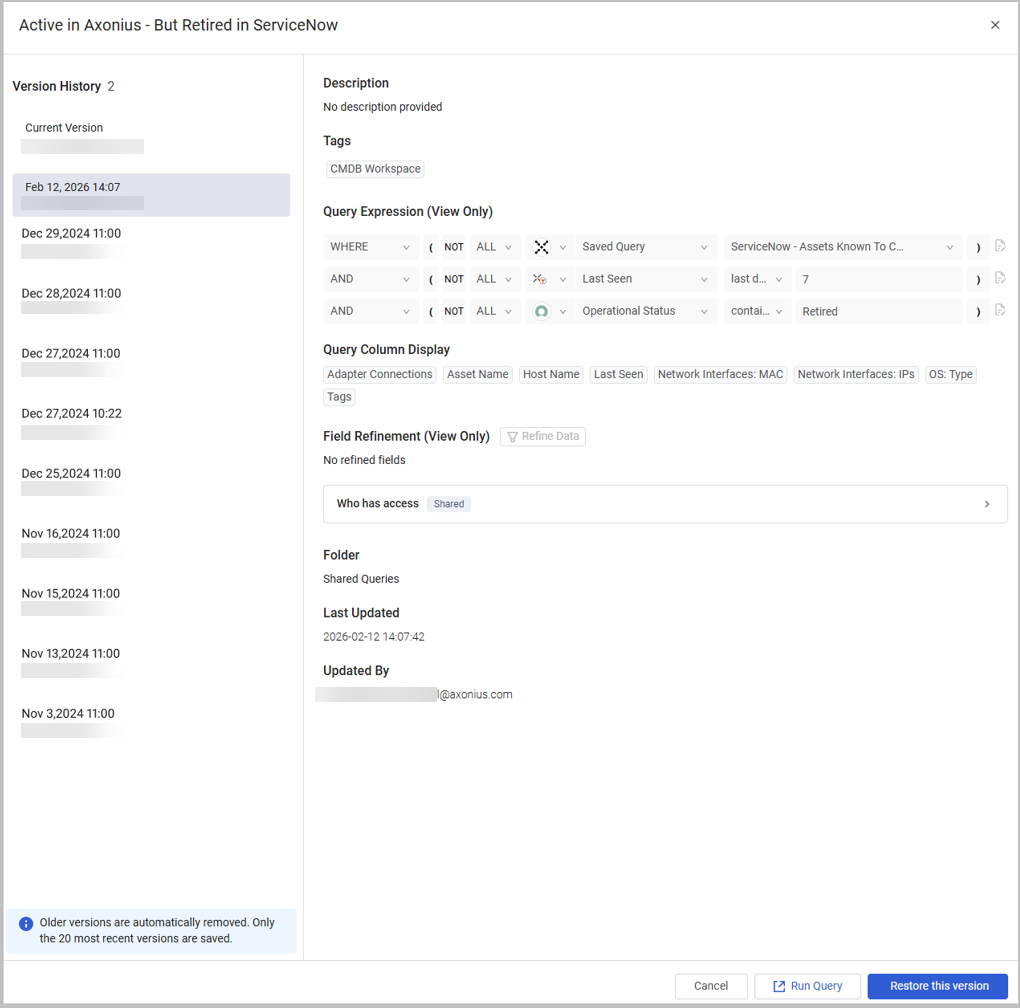
From the saved query's drawer, click Query Version.

-
The Version History section opens on the left. It lists the 20 most recent versions (older versions are automatically removed) in a descending order. Each version includes the following information: When it was modified (date and time) and the user who modified it.

-
Select a version from the list and click Restore this version. Then, click Restore.
Attention
Restoring a specific version affects the saved query everywhere it is used and might also change the access permissions. After you click Restore this version, a popup shows you where this query is used, so you can review it before continuing.
Restoring Archived Queries
Version history is preserved when queries are archived (moved to Archive folder). That means that you can access the Version History section of the query even if it's archived. However, to restore an earlier version of an archived query, you must move it first from the Archive folder to a different folder.
Updated about 2 months ago
