Asset Data Chart
The Asset Data chart allows you to visualize asset field values with each asset displayed as a row in a table or an individual asset card. You can view data for all assets of a particular type, or you can filter the data using a new or saved query.
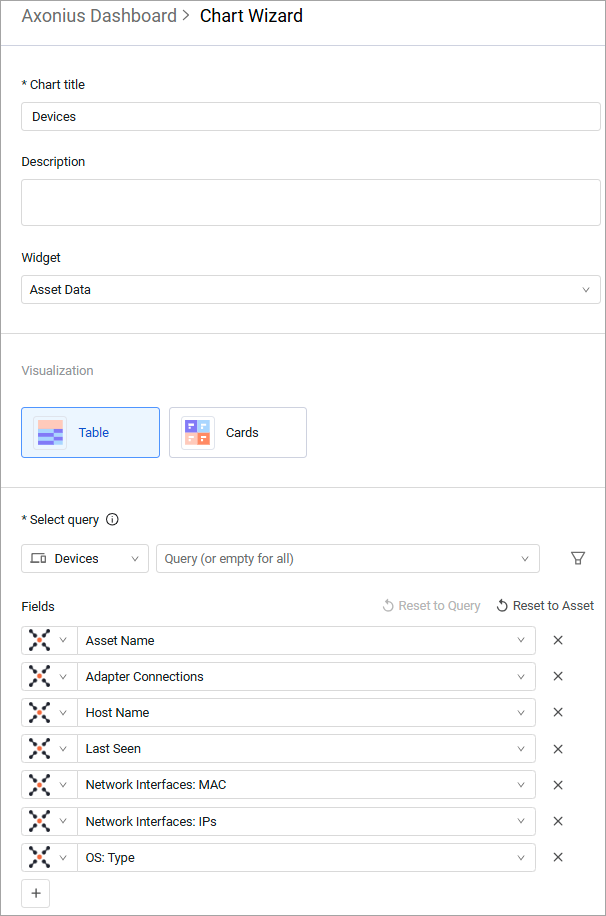
Visualization Options
You can select to display the asset data in Table or Card view.
Table View
The Table view generates a table to display the data according to the query and fields you select. If you select a saved query, the table's columns will be the same as those used in the query.
Note
When you select adapter data in Asset Data tables, the tables only present them in aggregated rows. The table cannot be expanded to individual rows per adapter entity.
Card View
In the Card view, each asset is presented as a separate card. You can choose as many fields as you want. The cards change size to accommodate the number of fields or allow for scrolling within each card.
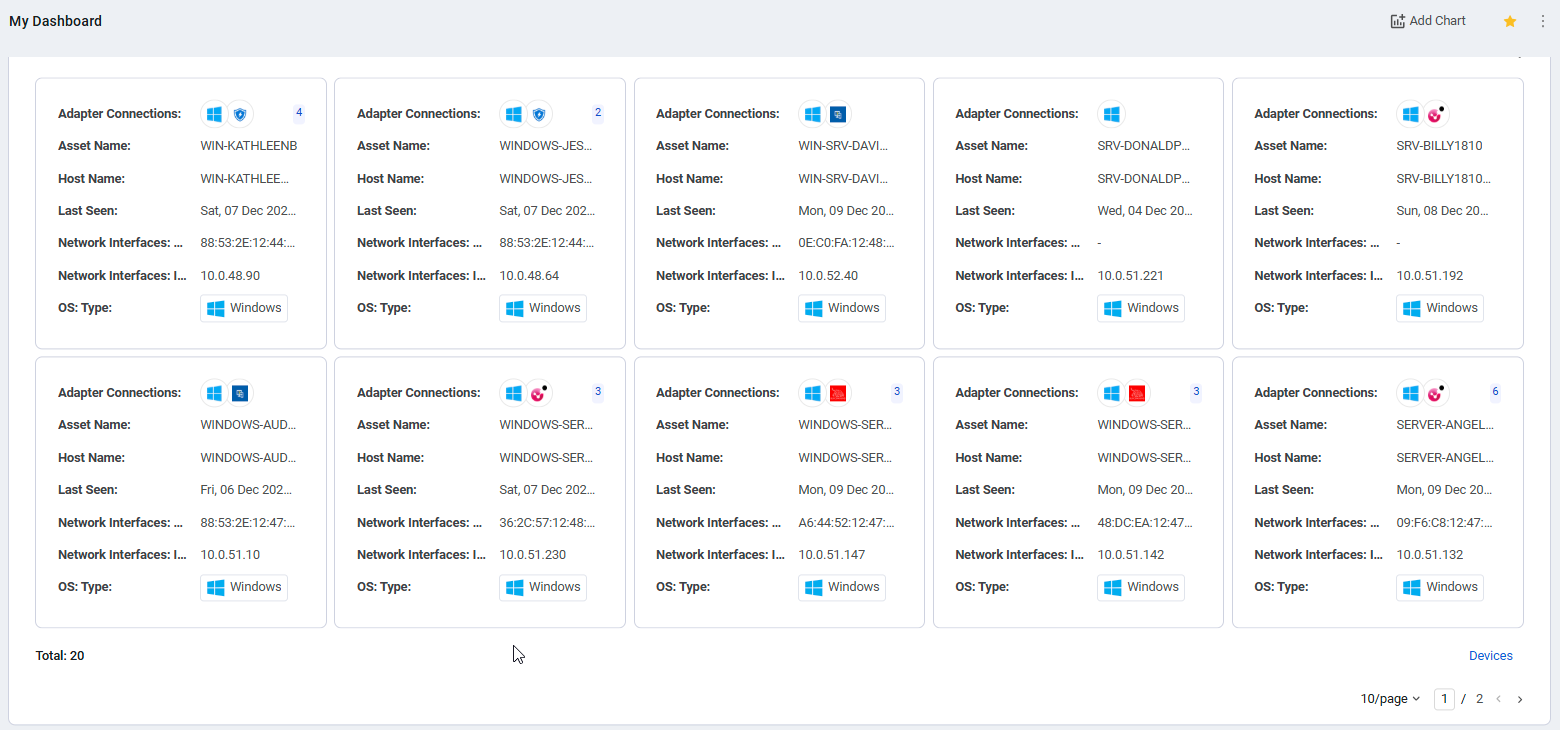
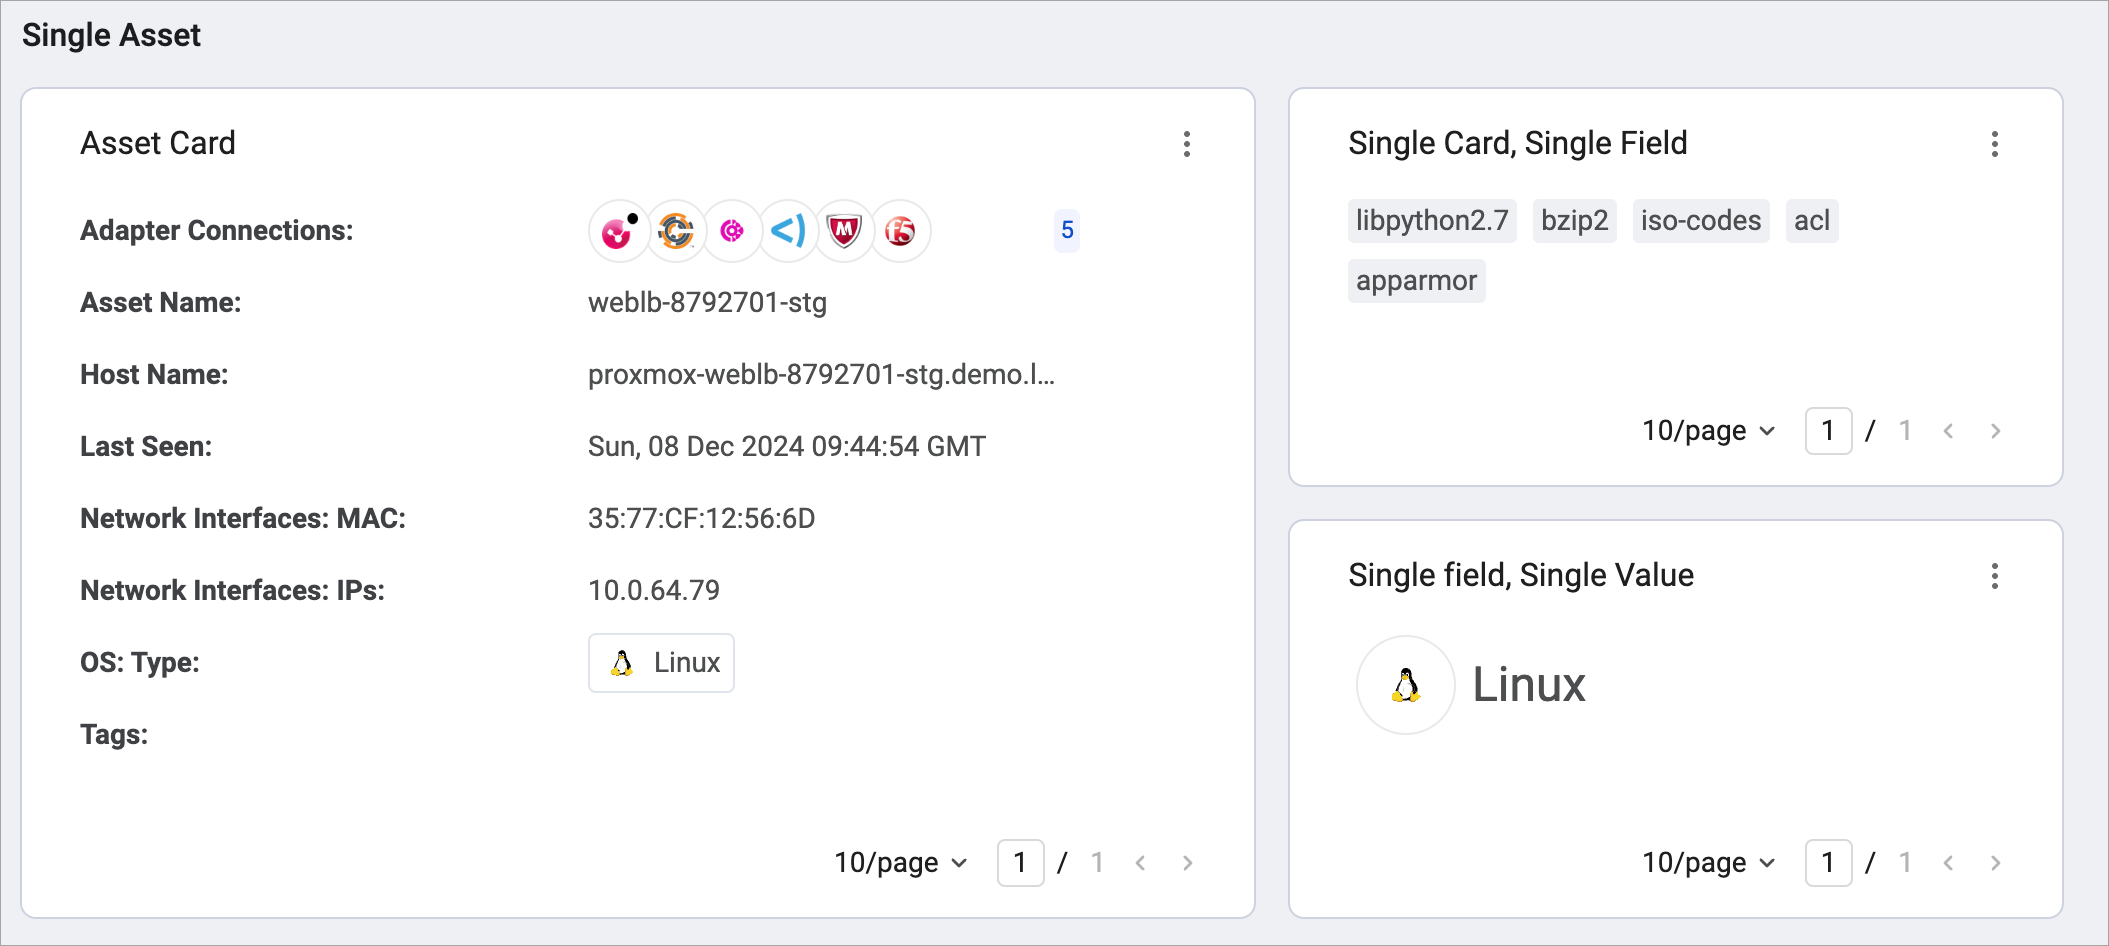
If the cards you create contain only one field, the cards display the field values without the label, so make sure the chart's title clearly describes the data represented by the field values. If the field includes just a single value, the text is displayed in a larger size to emphasize it in your dashboard. This is especially relevant for dashboards that analyze a single asset.
Refine Data
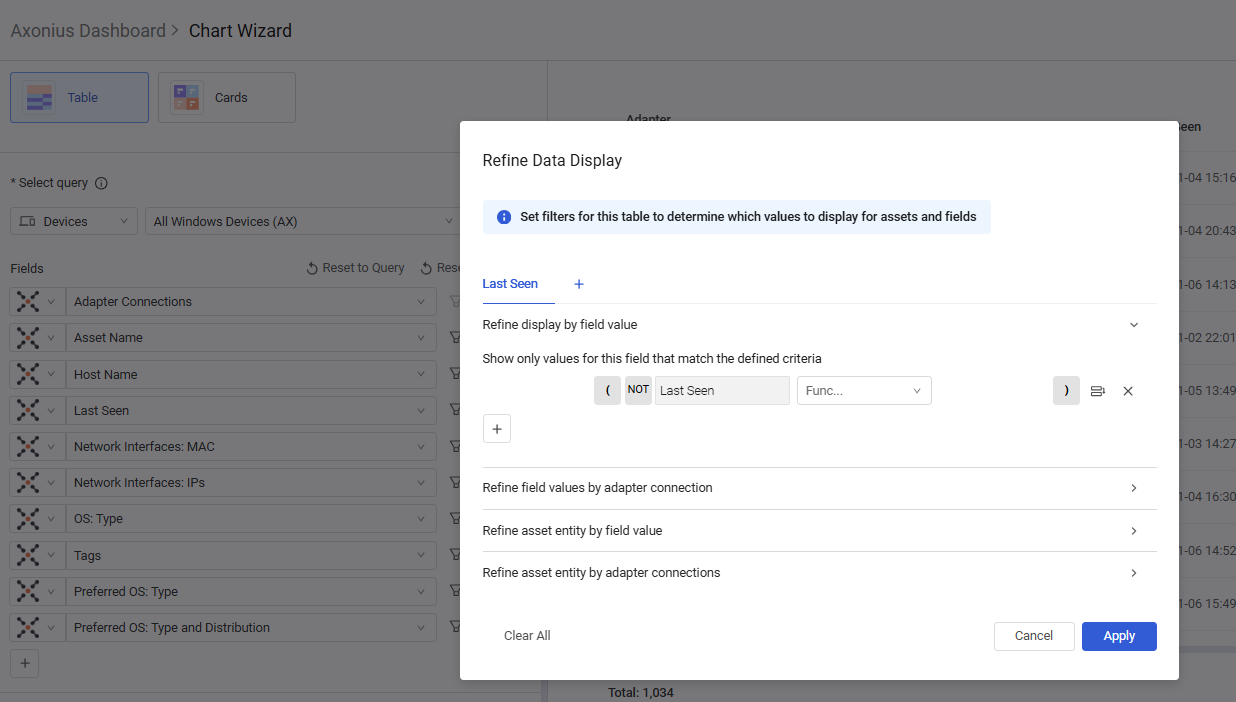
You can refine the data displayed in the chart for both Table and Card views, with refinements applied separately for each field, just as you can refine data on Asset pages. When you refine data, the query's asset count remains the same, even though Assets containing certain values do not appear on the chart.
When you click from the Dashboard to the relevant asset page, the configured refinement is applied to the asset page. However, when you refine data in a saved query and use it as the base query in the chart configuration, the chart does not automatically apply that refinement to its displayed data.
Create or Edit the Asset Data Chart
You can create or edit the Asset Data chart in the Chart wizard.
To configure an Asset Data chart:
- In the Chart title text box, enter a title for the chart.
- (Optional) In the Description text box, you can add a description.
- From the Widget list, select Asset Data.
- In the Visualization area, select Table or Cards.
- Under Select Query, select an asset type module and a query from the Query list. When an asset module is selected, but no query is selected, values are displayed for all assets of the selected module. The fields section shows the default fields for the chart, based on the selected asset or the saved query.
- (Optional) To add a filter to the query, click the Filter icon
.png) and configure the filter(s) you want.
and configure the filter(s) you want. - (Optional) To change a field displayed in the chart, in the Fields section, select aggregated data or an adapter, and the field you want to appear.
- (Optional) To add fields to this chart, click the Add button
 and select the fields you want to display.
 - (Optional) To refine the values displayed for a field, click the Filter icon
.png) corresponding to that field and configure the refinement in the dialog that appears.
corresponding to that field and configure the refinement in the dialog that appears. - (Optional) To set the sorting by a specific field click the Sorting icon
 next to that field. Click it again to change if the assets are sorted in ascending or descending order for that field's values.
Note
The table sorting cannot be changed from the Dashboard.
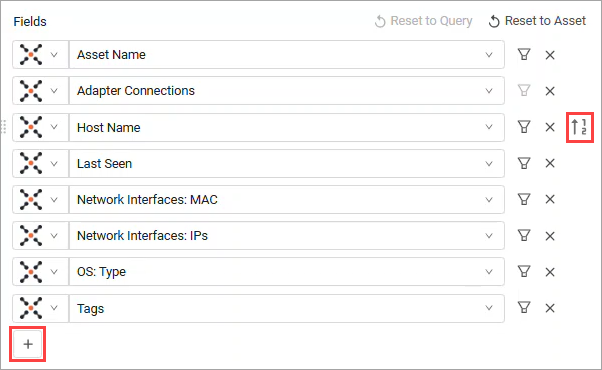
-
(Optional) To reset the field list to the default for the selected query, click Reset to Query.
-
(Optional) To reset the field list to the default for the selected asset, click Reset to Asset.
-
(Optional) Set the chart to display results from a relative or fixed historical date. See Viewing Query Results from a Historical Date.
-
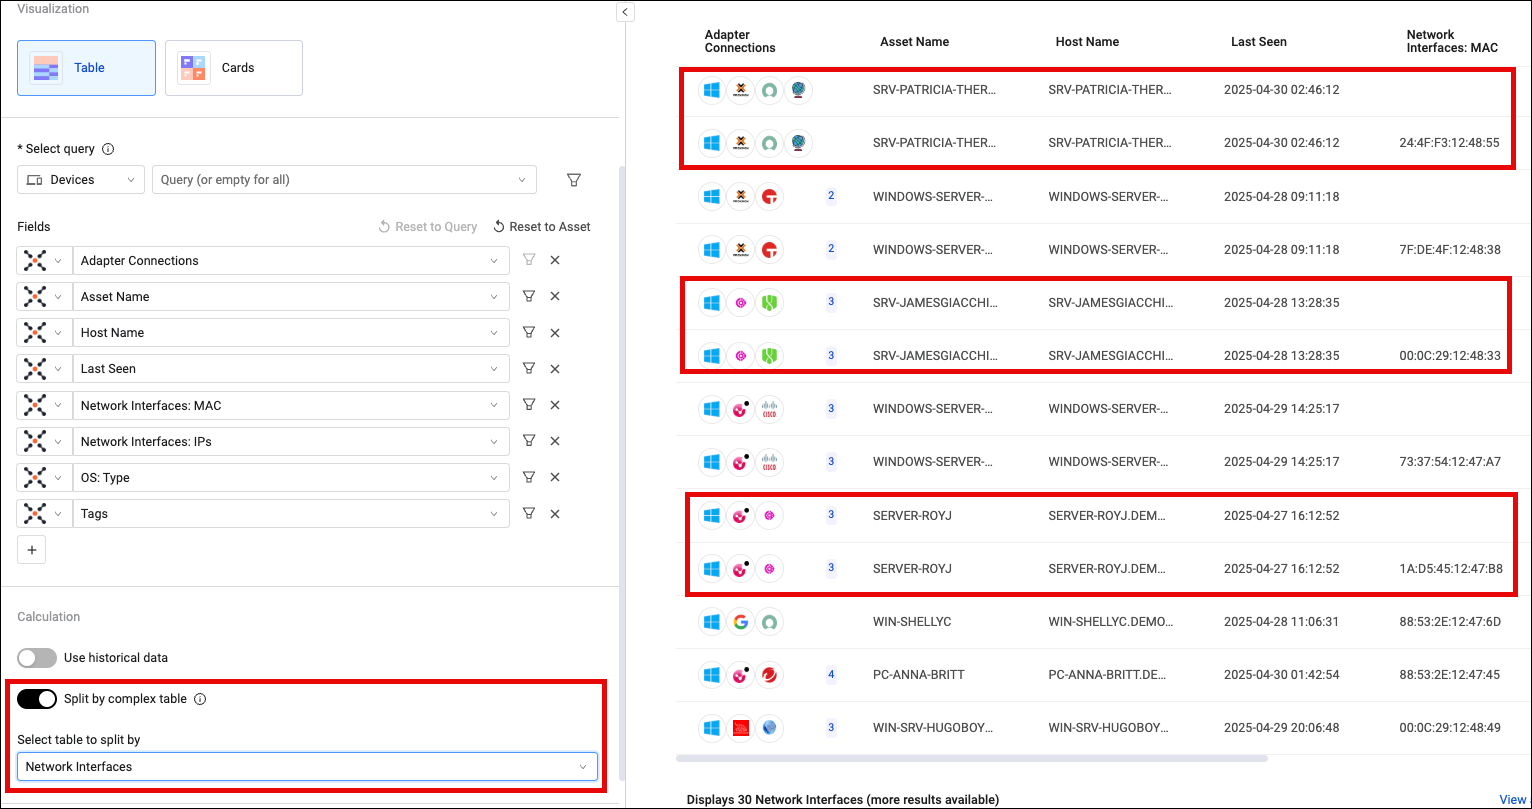
(Optional) To split rows with multiple values for complex tables so each value is displayed in its own row, enable the Split by complex table option and select the table you want to split. Any time that complex table contains multiple values, a separate row is created for that value.
-
Click Save to save the configuration and add the chart to the dashboard.
Note
The chart displays up to 20 assets instead of all assets. If users want to explore more assets, they can drill down from the chart to the specific asset page.
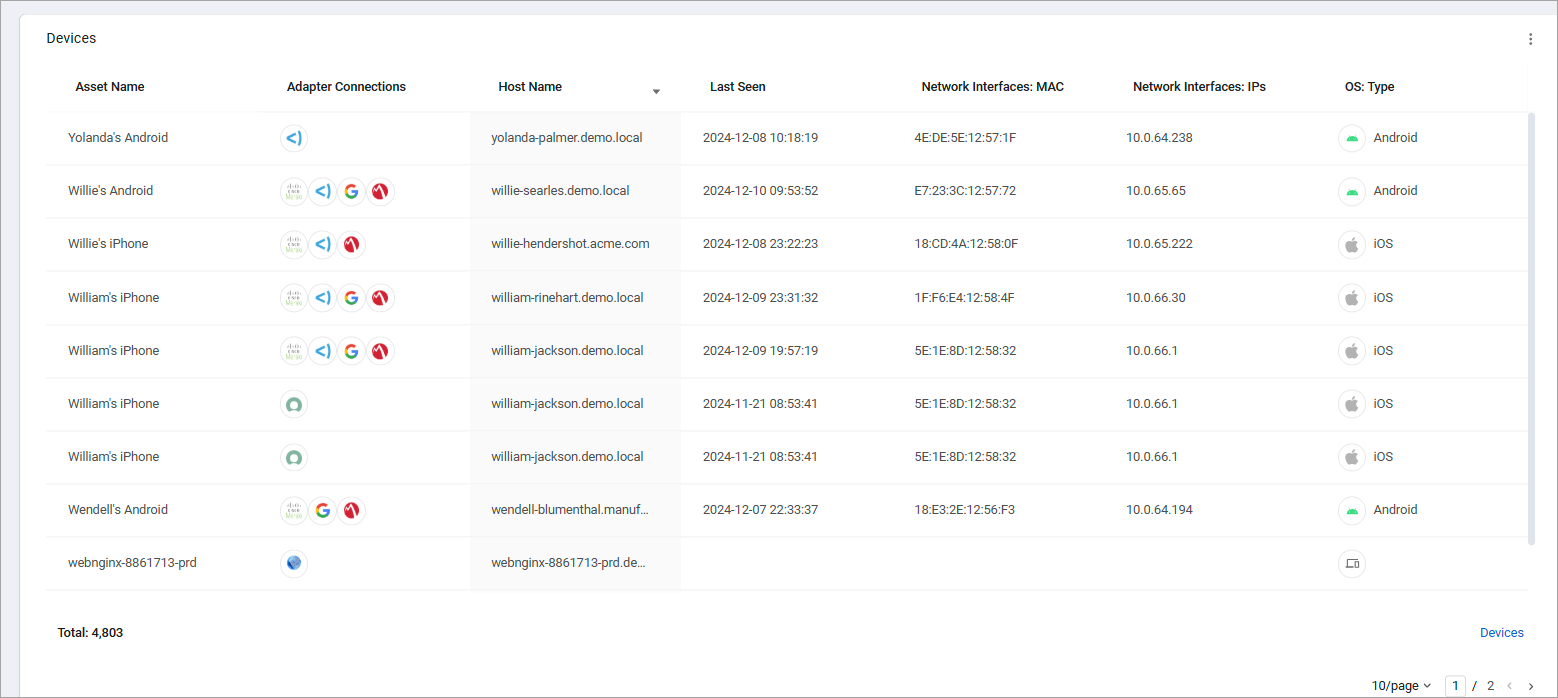
The Table visualization is based on the assets tables, meaning any asset table functionality will apply.
Click on the asset link at the bottom of the page to view the Asset summary for the displayed assets. Click the Asset Page to view the assets at their relevant Asset page.
Updated about 2 months ago
