
Report Content
Axonius Reports generates a pre-defined executive report, in a PDF format, which includes all Axonius Dashboard charts, a selected list of saved queries for devices or users, or combination of both, as well as Data Analytics Reports reports. The report also includes links to the relevant Axonius page to see additional details. If you have set email configuration, the report is sent by email when it is generated.
You can download the last generated report.
Note
The sections included in the report depend on the report configuration. See Configuring Reports.
The Report PDF file can include some or all of the following sections:
- Cover page
- Table of Contents
- Axonius Dashboard
- Dashboard Charts
- Devices - Saved Queries
- User - Saved Queries
- Data Analytic Reports
Cover Page
Includes the report name and the time and date the report was generated.

Table of Contents
A list of the report sections, according to the report configuration. Each section starts on a new page.
Axonius Dashboard
Includes all Axonius Default Charts.
The report structure is 4 columns and two rows on each page, i.e. when a chart is one column 4 charts will be displayed per page. The pie charts and the Matrix table are always 2 columns.
To open the Axonius dashboard charts in Axonius, click View in Axonius next to the title.
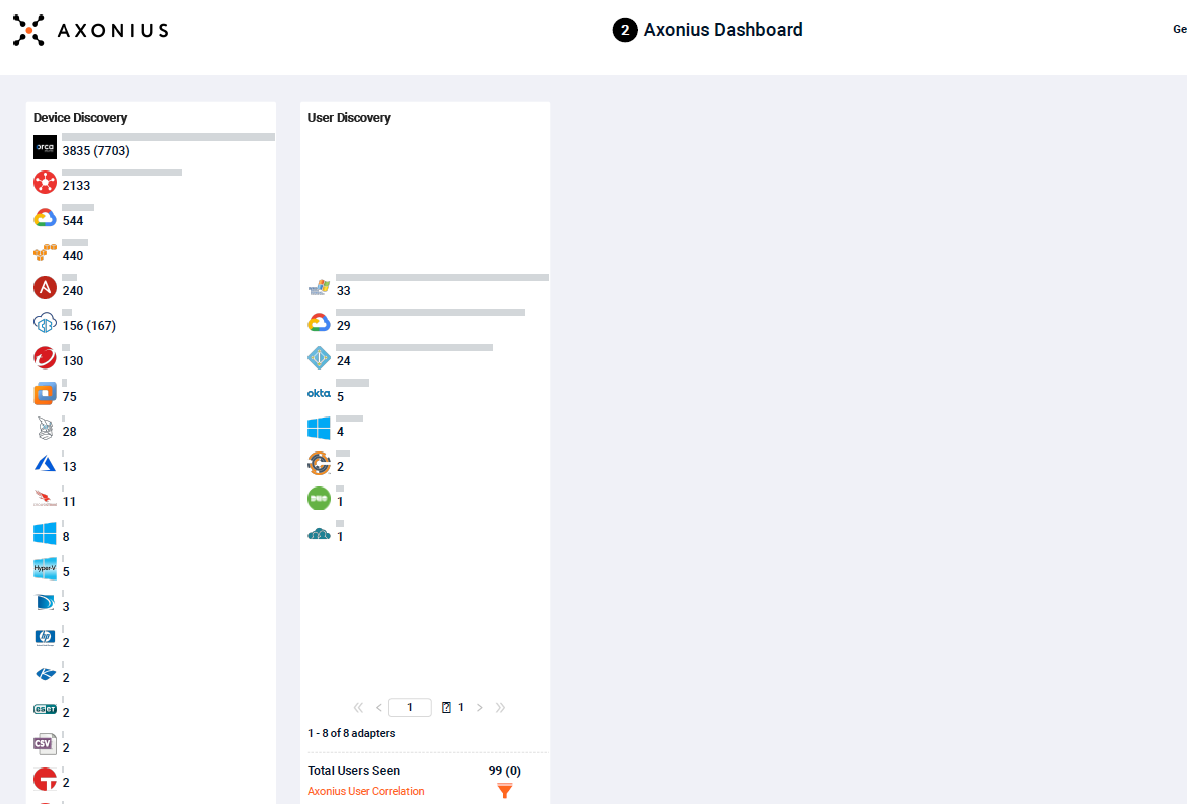
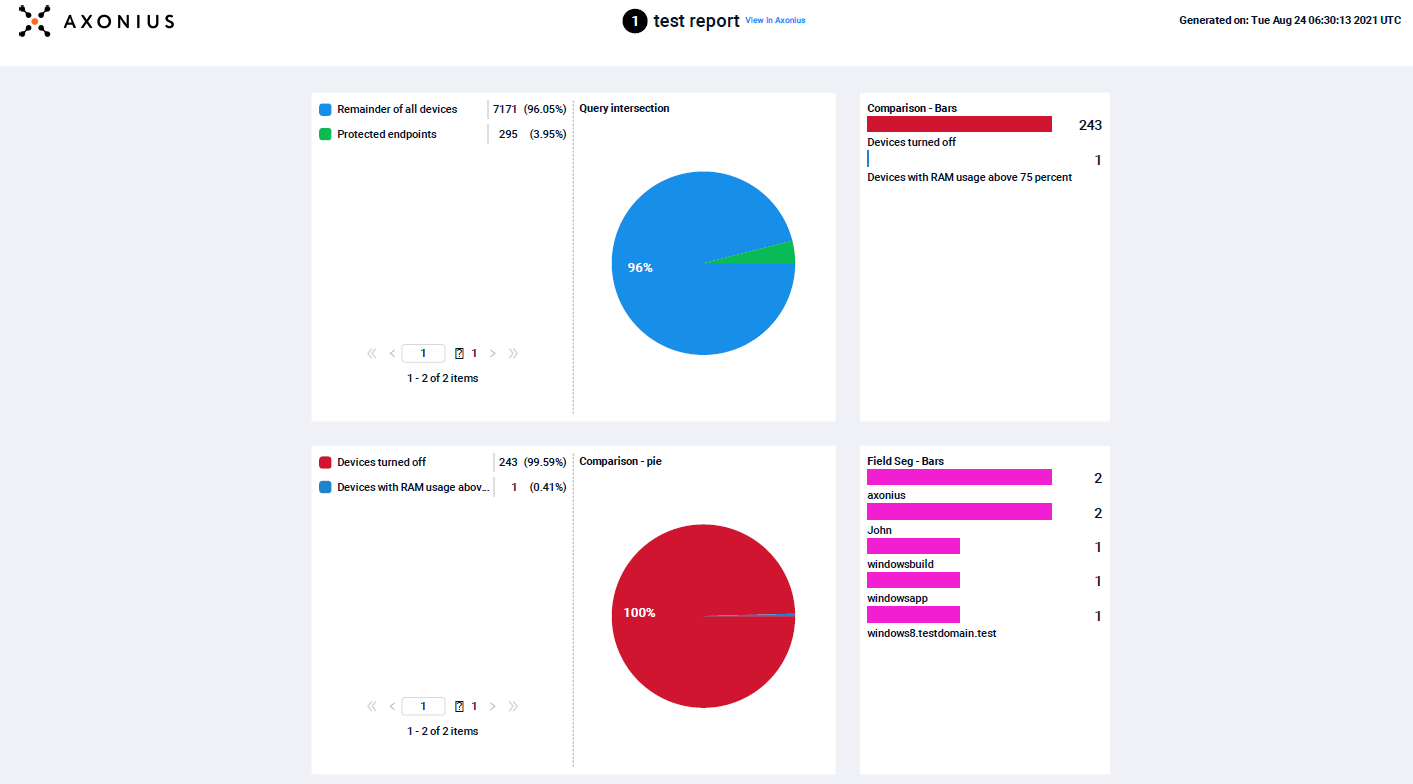
Dashboard Charts
Includes all custom charts and the following Axonius dashboard default charts:
- Device Discovery
- Adapter Connections Status
Those default charts and any other custom pie charts include a legend that describes what data each of the chart slices represents.
For details about the different charts, see Default Charts and Custom Charts.
To view the full charts, click the 'View in Axonius' link next to the title.
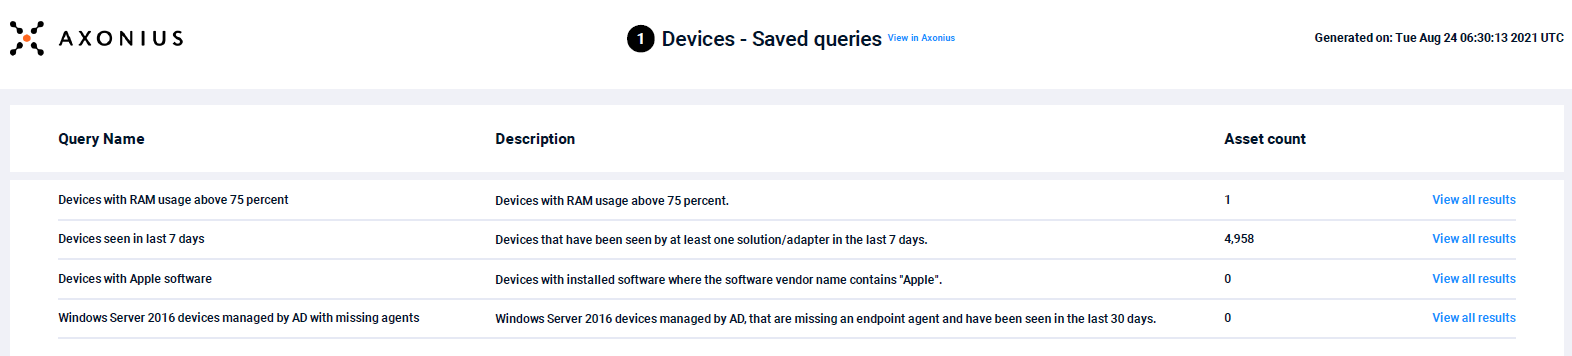
Assets - Saved Queries
Includes the Devices/Users/Security Findings/Software saved queries listed in the report configuration, ordered according to the saved query name sorted alphabetically.
Each saved query consists of the following information:
- Query Name - The name of the query
- Description - The description of the query that the user entered when they created the report.
- Asset Count – the number of assets discovered in that query
- View all results - Link to the full query results on the Devices page.
If no results are found for a specific query, the asset number is shown as 0.
For details, see Saved Queries.
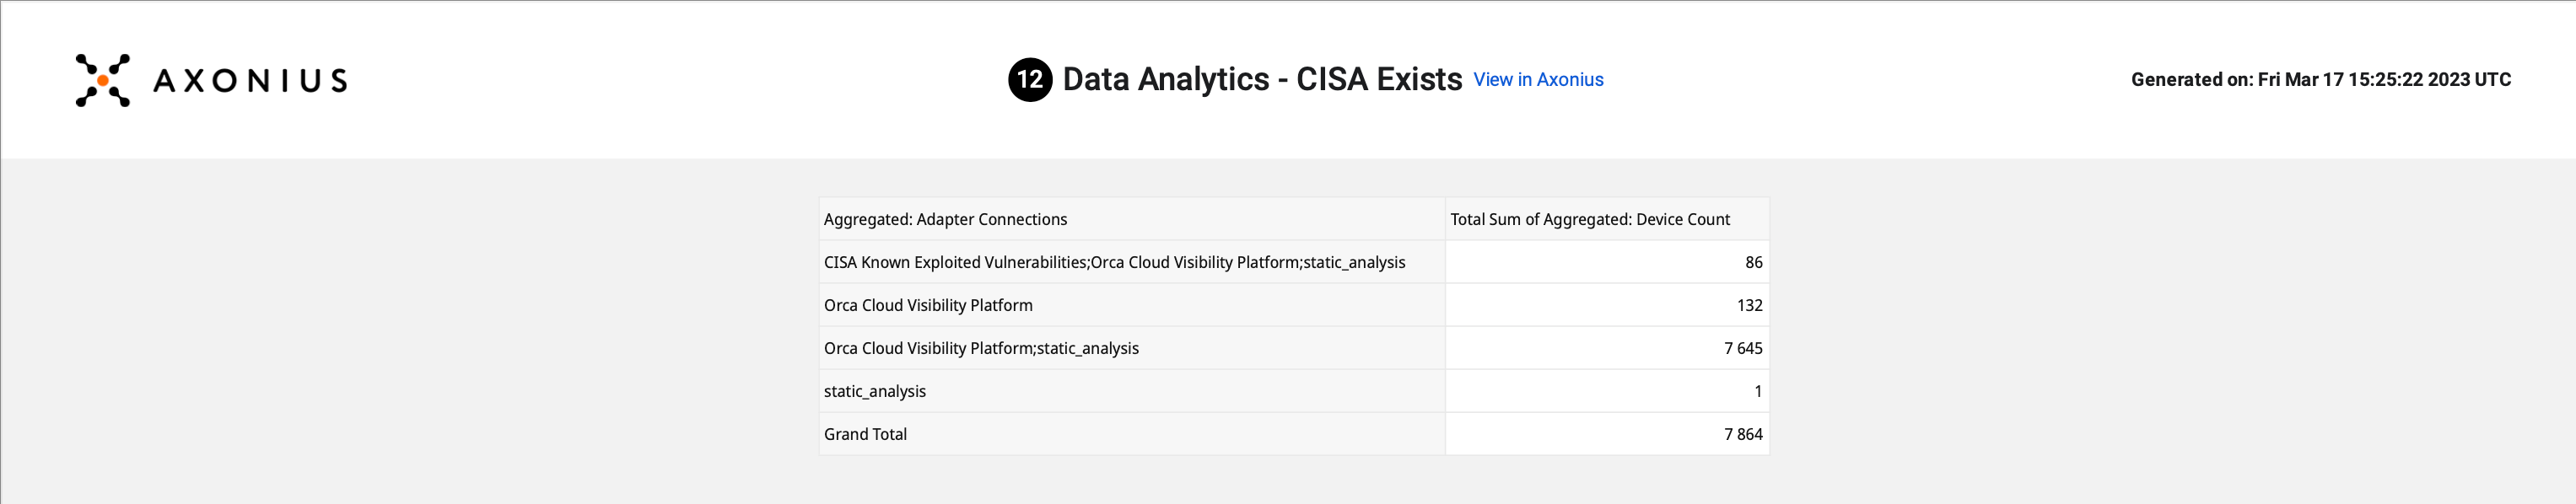
Data Analytic Reports
Includes the selected data analytic reports created using the Data Analytics page.
Updated 6 months ago