Adapters Fetch Events
Fetch Events Overview
Use Adapters Fetch Events to view detailed information and investigate the progress of the adapter fetch process and various events that occurred during that process. Some adapters fetch multiple asset types (for example, devices and users) or fetch additional data from various services, such as installed software, security findings or additional user information. In such cases, the adapter fetch process consists of a number of stages. Each stage has its own status update and potential failures that may impact the overall result of the fetch process.
To open the Adapters Fetch Events page, from Adapters Fetch History click Adapters Fetch Events. From Adapters Fetch History you can also right click Adapters Fetch Events to open it in a new tab.
Alternately, on the Adapters Fetch History page, click a value in the Fetch Events column. The Adapters Fetch Events page opens, filtered for all events for the specified fetch.

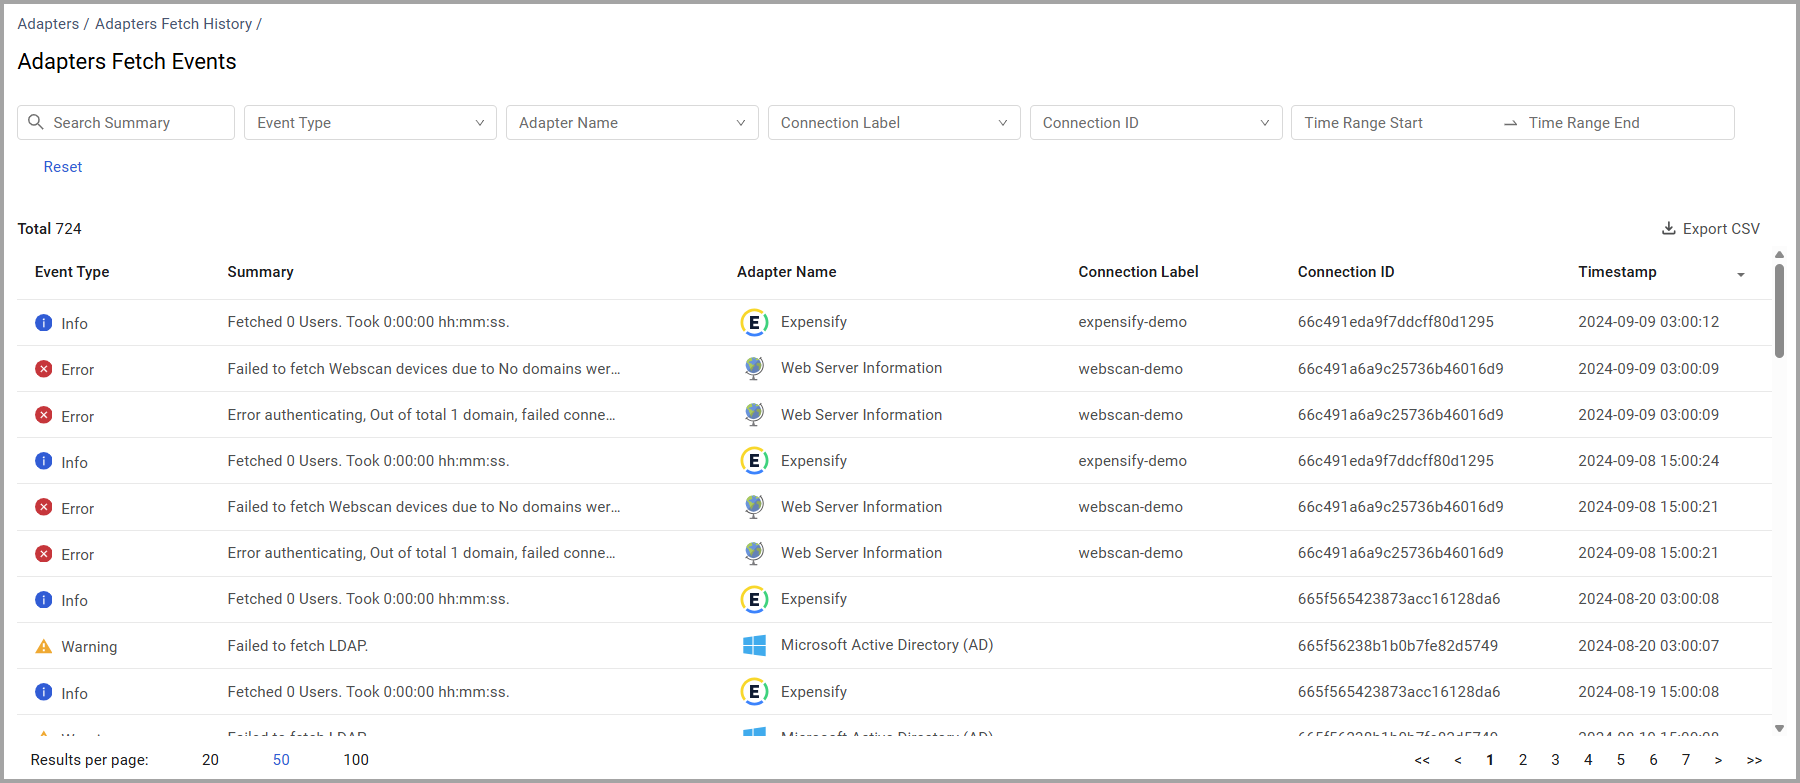
The following information is displayed:
- Event Type – The event type, together with an icon. The following Event types exist: Info, Warning, Error.
- Summary – a description of the event type.
- Adapter Name – the adapter for which the event is being reported
- Compute Node – The name of the compute node.
- Connection Label – the connection label (if configured).
- Connection ID – the connection ID.
- Timestamp – the time the event happened, according to the browser time zone.
Events are displayed in order from newest to oldest.
Changing the Order Columns are Displayed
You can change the order of columns displayed. Drag and drop columns on the table to arrange them in the order you want. The changes are only for the current session.
Search and Filter of the Events
Use the Search bar at the top of the page to find a specific event and to filter the list of events displayed.
- Search Summary –- Enter text to search the summary by; the system returns all summaries including that term.
- Event Type – Select an Event Type to filter the display by event type. Click Clear All to clear all selections.
- Adapter Name – Select an adapter name to filter the display by adapter name. Click Clear All to clear all selections.
- Connection Label – Select a connection label to filter the display by connection label. Click Clear All to clear all selections.
- Connection ID – Select a connection ID to filter the display by connection ID. Click Clear All to clear all selections.
- Time Range – Use the date picker to filter the display by events which happened on a certain date or in a certain date range.
Click Reset to clear the search and filters and reload all results.
Click Save As to save the filters/search as a Query.
Adapter Event Details
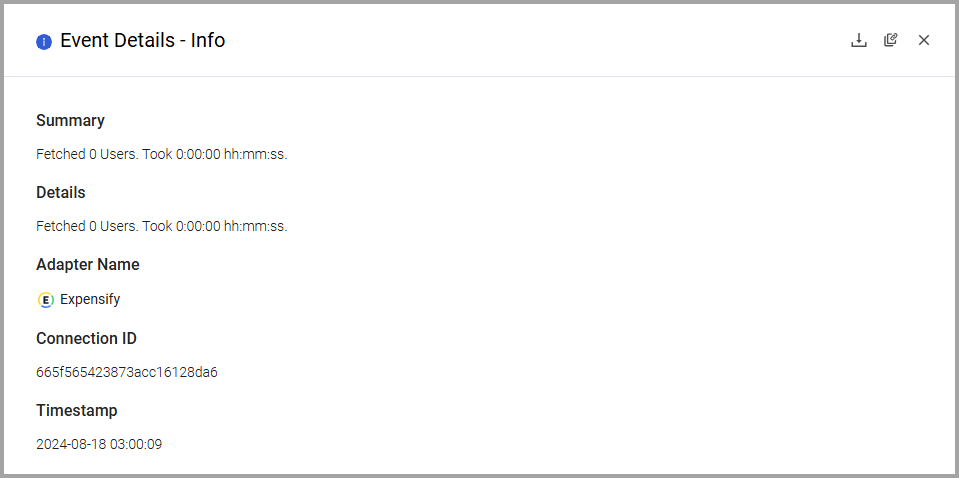
Click on a row to see all details of the event; the Event drawer opens.

The drawer contains the following information:
• Summary
• Details
• Adapter Name
• Connection label (if set)
• Connection ID
• Timestamp
- Click
 to copy the event link.
 - Click the download button to create a text file with full details of the event data. This is useful for further investigation of problems.
- Click Export CSV to export the results to a CSV file.
If you display results according to a defined filter, this exports results according to the filter you chose. The exported data also includes the details of each event. The CSV file is namedAxonius_fetch_event_– it opens straight away in your default spreadsheet application. The timestamp in the CSV file is in UTC.
Note
You need appropriate permissions to export to CSV.
For general information about working with tables, refer to Working with Tables.
Updated 3 months ago
