
Asset Profile View
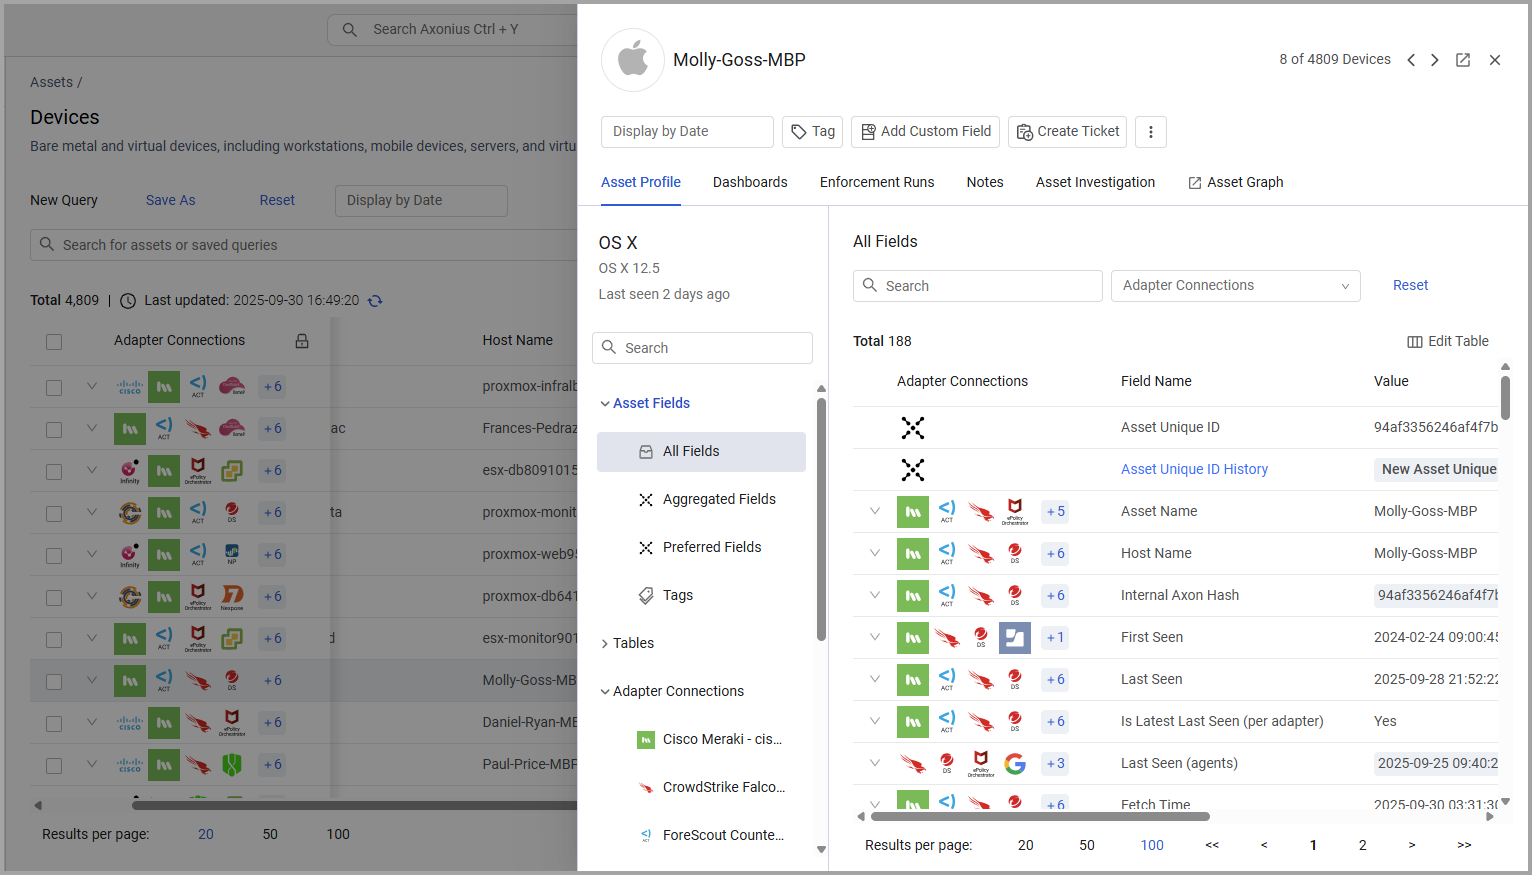
The Asset Profile drawer displays all the collected and correlated details about the asset selected.
To open the Asset Profile drawer from the Assets page, click the relevant asset record. The Asset Profile drawer slides out from the side of the screen.
There are two ways to open the full Asset Profile page in a separate tab.
- From any Assets page, click the Actions icon at the right of the relevant asset row, and from the Actions menu, select Open
<asset name>Profile.
For example, on the Devices page, select the checkbox of a device, and from the Actions menu, select Open Device Profile. - From the top-right of the Asset Profile drawer, click the
 Open Device Profile button.
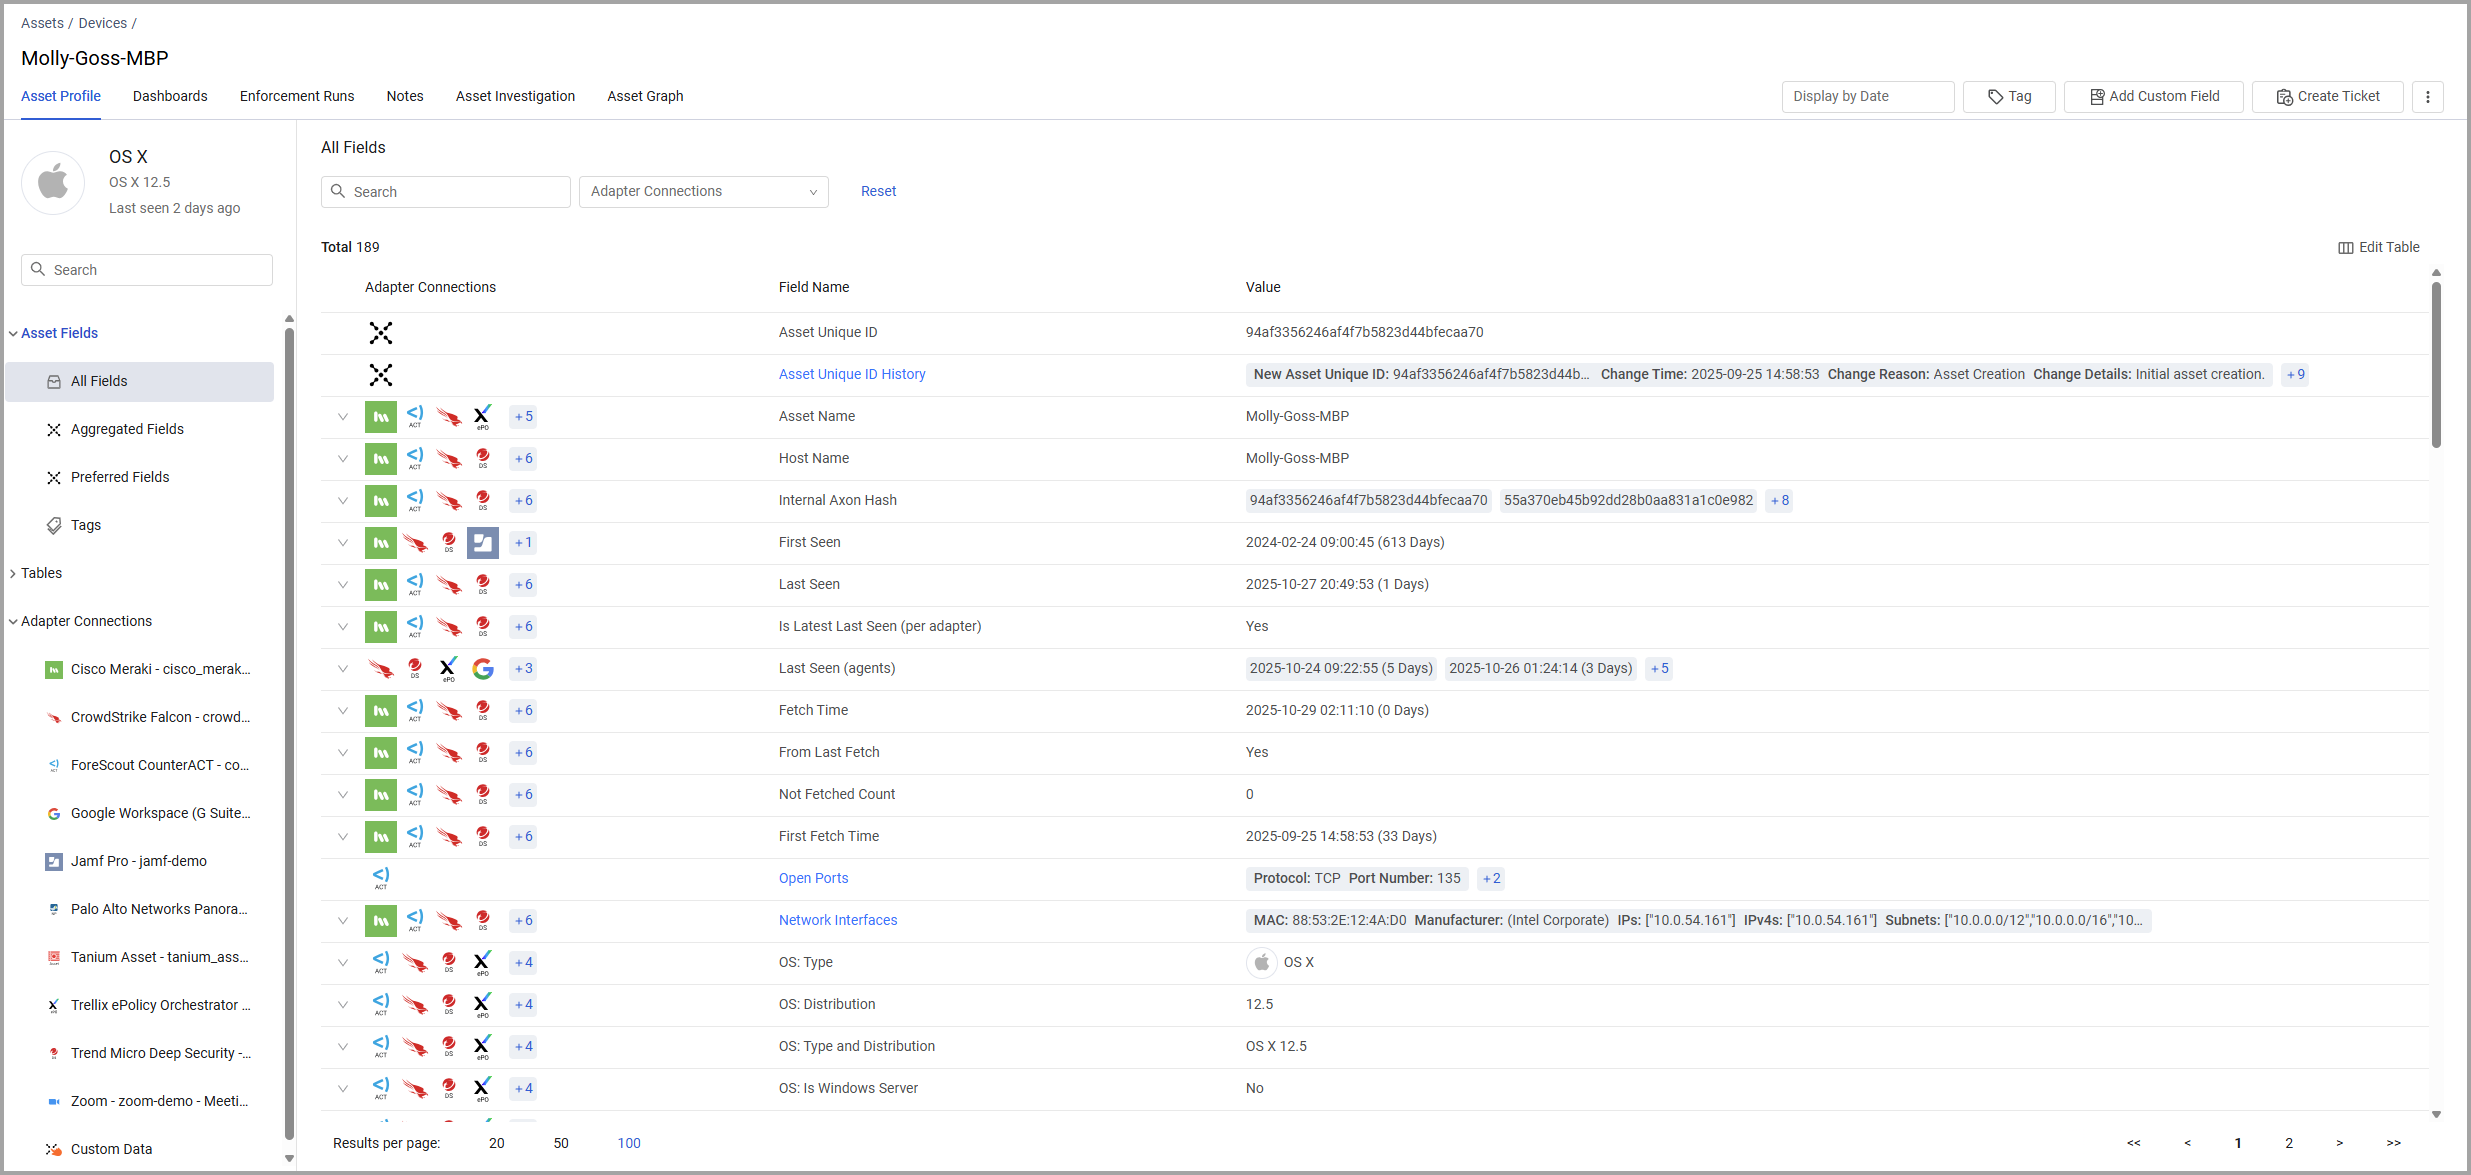
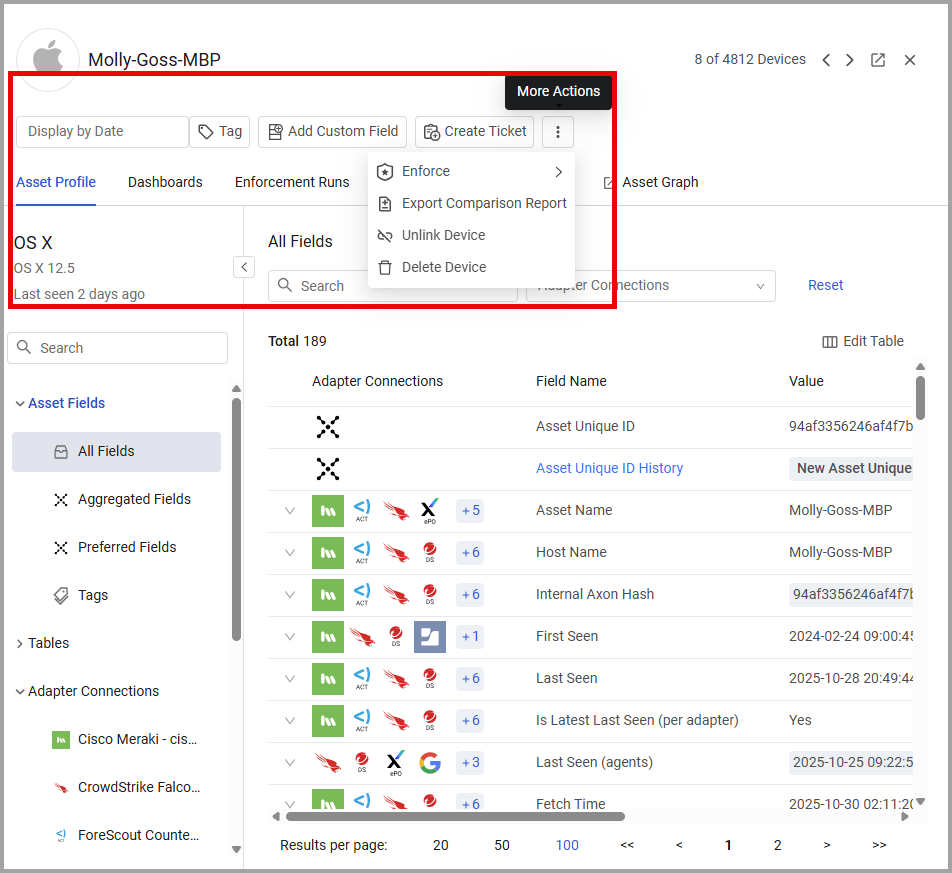
The Asset Profile shows all of the fields fetched by that asset in one place. It is divided into a left pane and tables. Choose various options in the left pane to display different tables. The profile name in the header is the 'Host/Asset Name' of the selected device, the 'User Name' of the selected user, and other relevant names for each asset type.
Asset Profile Tab
In the Asset Profile tab, the Asset Profile table shows all of the fields fetched from the asset. It shows consolidated and correlated data from all adapters about the asset. For each field, you can see the adapter connections that fetched the field and the value(s) of the field.
-
Field Name - Displays the name of the field. Complex fields (fields that can display a number of parameters, for example, 'Installed Software') are displayed as links. You can click a complex field to present all of the information in that field in table format (refer to Tables). You can also click fields that link to associated assets, such as Last Used User field. Click a column to sort it in alphabetical order. Click the arrow to see all adapters that fetched the field and its value on each of them.
-
Value - Displays the value of the field. If more than one value is available, the first few values are displayed with the number of additional values available shown in blue.

Hover over the link to see the first ten values for that field. For list fields, you can click the copy icon
 to copy the values to the clipboard.
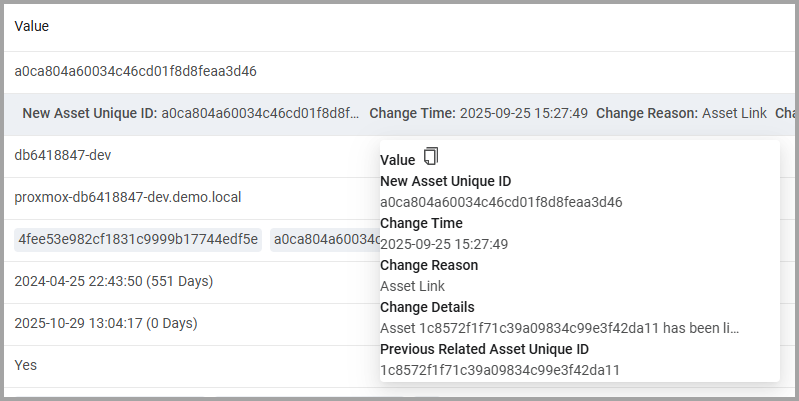
-
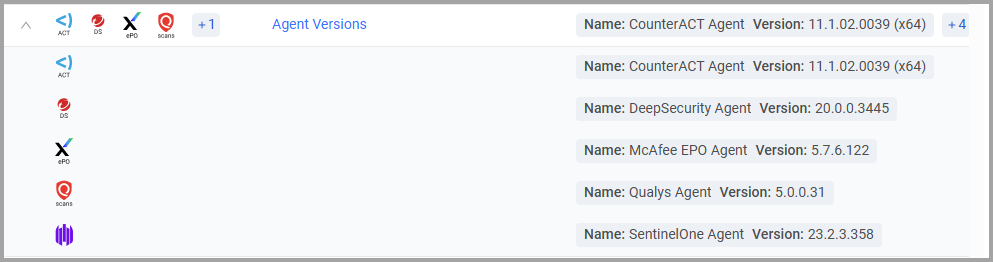
Adapter Connections - Shows the adapter connections from which the field was fetched. Hover over a field to see the adapter or all the adapters that this information comes from.
Click the arrow next to the field name to see all adapters that fetched the field and its value on each of the adapters.
Filtering and Searching
You can filter the display by Adapter Connections:
Adapter Connections - Select Adapter Connections to display. When there are a number of connections for a specific adapter, you can choose the connection you want to see.
Search - Enter any value by which to search for a field type or field value (this is a free text search).
Asset Profile Actions
On the top of the page, you can access the following options to perform quick actions or Enforcement Center actions on the asset:
- Display by Date
- Tag
- Add Custom Field
- Create Ticket
- Enforce
- Export Comparison Report
- Unlink Device
- Delete Device
For more information about these options, see Asset Actions.
The Side Pane
Use the side pane to view different information in the Asset Profile table You can click the arrow to collapse and expand the side pane. Use Search to find any value in the side panel.
Asset Profile Information
The Side pane shows profile information about the Asset (depending on the asset type). This information presents the Profile ID for the asset to help you understand details about the asset you are looking at. Each asset shows relevant fields. Data from the following fields is displayed by default for devices and users. If there are no values in these fields, they are not displayed.
Device Information For each device, the following default information is displayed (when available).
- An image that represents the operating system
- The preferred Operating System of the device (Windows, Linux, iOS etc.)
- The preferred device model
- The last seen value
User Information For each user, the following default information is displayed (when available):
- The user profile picture (if this is available)
- User name (first name and last name)
- The user's title
- The user's department
Customizing the Asset Profile ID
You can customize the Asset Profile ID, so that fields other than the default fields will be displayed for all the assets in a module. Users without admin permissions can edit the Asset Profile ID for all relevant assets that they will see in this module. Admin users can set an Asset profile ID that will be displayed for all the users of their system who use default settings and have not set their own customized view.
To edit the Asset Profile ID
-
In the full profile page view, hover over the title of the Asset Profile. A pencil icon appears.
-
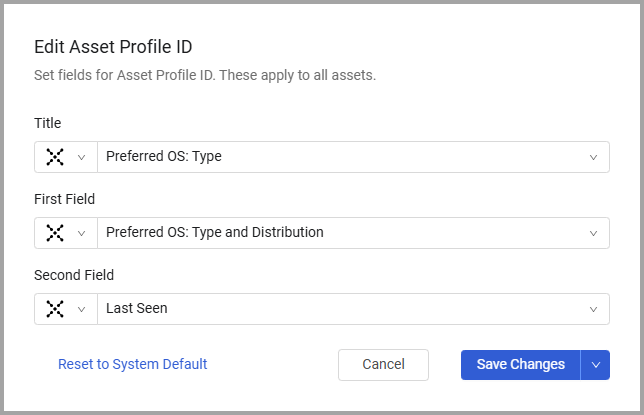
Click the Edit Asset Profile ID pencil. The Edit Asset Profile ID dialog opens.
-
From the Title drop-down, select a field that will be the Asset title. The contents of the field that you selected will appear as the title for the asset.
-
From the two additional drop-downs, select two other fields that will be displayed as part of the Asset Profile ID. For each field, the contents of that field will be displayed as the Asset Profile ID.
-
Click Save Changes to save your changes. Now this is the Asset Profile ID that will be displayed for all assets of that type that you view.
-
Admin users can set default fields for all the assets in the system. To set default fields for all assets in the system, select Set as System Default from the Save Changes button. These settings apply for all users who have not set their own customized settings.
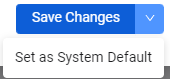
Select Reset To System Default and then Save Changes to restore the default system settings on your system. Admin users need to select Reset To System Default and then Set as System Default to restore default settings for all users.
Searching the Side Pane
You can search the side pane (below the Search box) by entering free text in the Search box. The system begins to show results as soon as you enter characters.
Asset Fields
Shows information about the fields on the asset.
- Click All Fields to display all of the fields in the Asset Profile Table.
- Click Aggregated Fields to display only Aggregated fields.
- Click Preferred Fields to display only preferred fields. Preferred fields are displayed with the default Axonius icon next to them.
- Click Tags to view information about tags on the asset.
Tags
Use Tags to view the list of all tags associated with the asset, as well as the date the tag was created, the date it was last updated, and the expiration date (if it is associated with a tag).
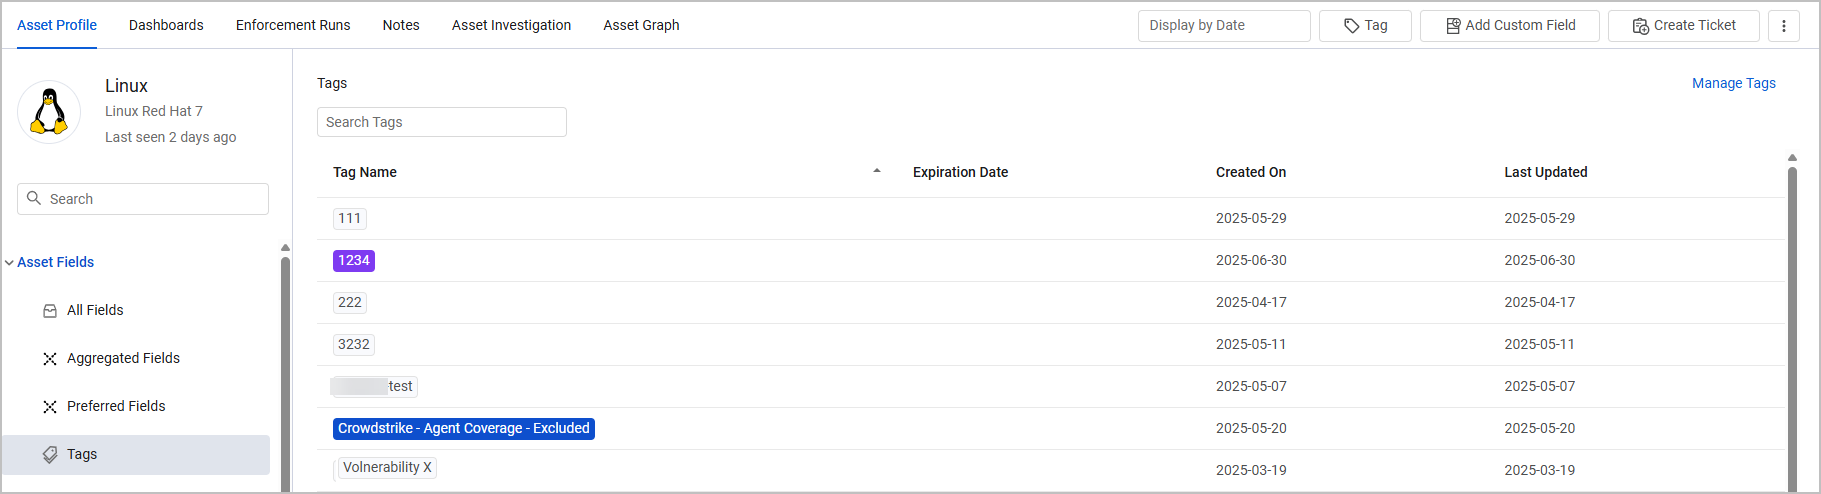
To edit the tags on the asset, click Manage Tags. The Tag (per asset) dialog opens. You can:
-
Select the tags to be associated with the asset and unselect tags you wish to disassociate from the asset. Read more about Working with Tags.
-
Set, edit, or delete an expiration date for tags (see Setting an Automatic Expiration Date for Tags).
-
Set a color for a tag, edit the tag color, or set the color to white (to display the tag without a colored background). See Setting Colors for Tags.
Tables
Use Tables to see information about complex fields. For more information, see Asset Profile Page - Tables.
Adapter Connections
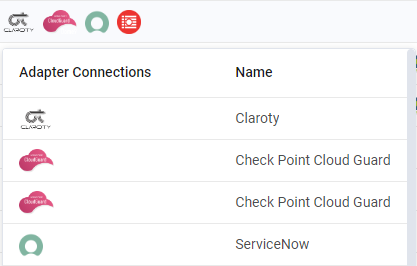
Adapter Connections displays all the adapter connections from which the asset fields were fetched. If you configured an Adapter Connection Label on the adapter connection configuration, it is concatenated to the adapter name value for the relevant adapter connection. This helps you distinguish between two adapter connections from the same adapter. Hover over an adapter connection to see its full details.
Click an adapter connection to see all the fields and their values on the device fetched by that adapter connection. The Adapter Connections table for that adapter connection opens.
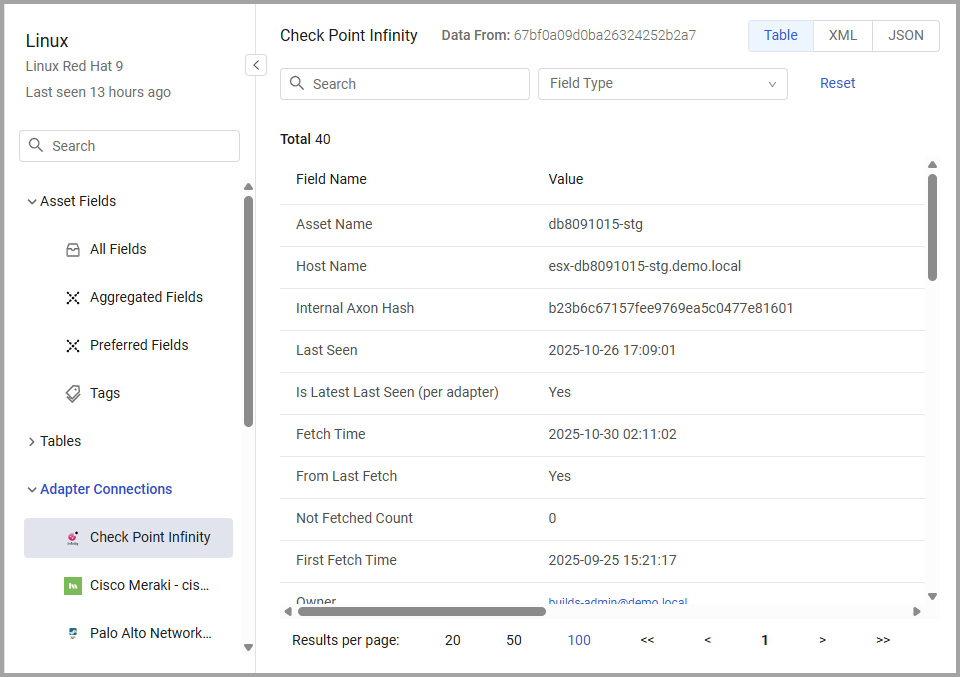
The table shows the Field Name, its Value , and whether the field is Common or Specific. Common fields are fields that appear on more than one adapter. Specific fields are fields that are only related to a specific adapter and will not be aggregated with fields from other adapters. Click on complex fields to display them.
- You can search each Adapter Connections page by fields or by values.
- You can filter by field type, either Common or Specific.
- You can also sort by Field Name and Field Type.
In addition to the different adapters listed under the Adapters Connections tab, you might see 'WMI Info' adapter. This adapter is displayed only if Axonius - Run Windows WMI Scan has been executed on the Microsoft Active Directory (AD) server that manages the device. For more details, see Axonius - Run Windows WMI Scan.
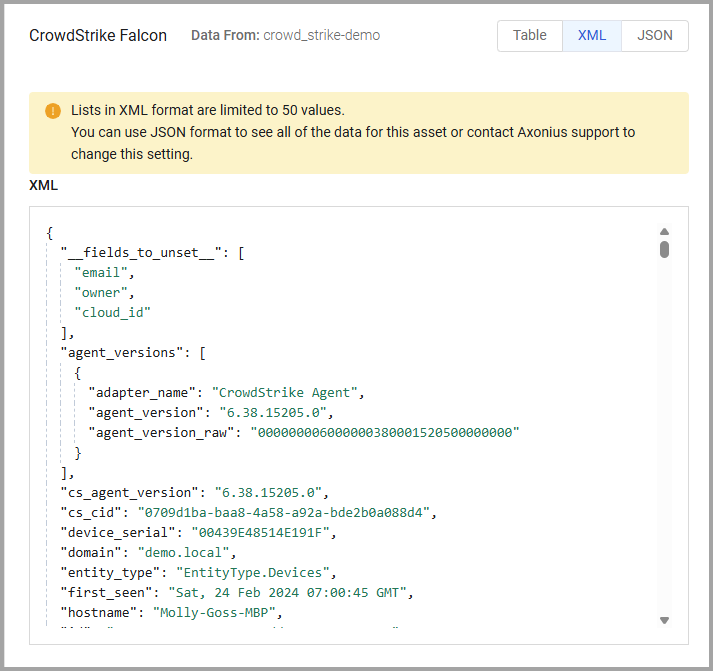
JSON and XML Advanced View
Each Adapter Connections table, with the exception of Custom Data, shows all the parsed data for that adapter connection. The XML and JSON views show the unparsed data including all table fields and data that was not parsed into the table (basic) view. You can move through different displays of the data:
-
Table - to see in a table (Basic) view.
-
XML - to see the raw data (Advanced view) as returned from the adapter, with unparsed data in XML format.
-
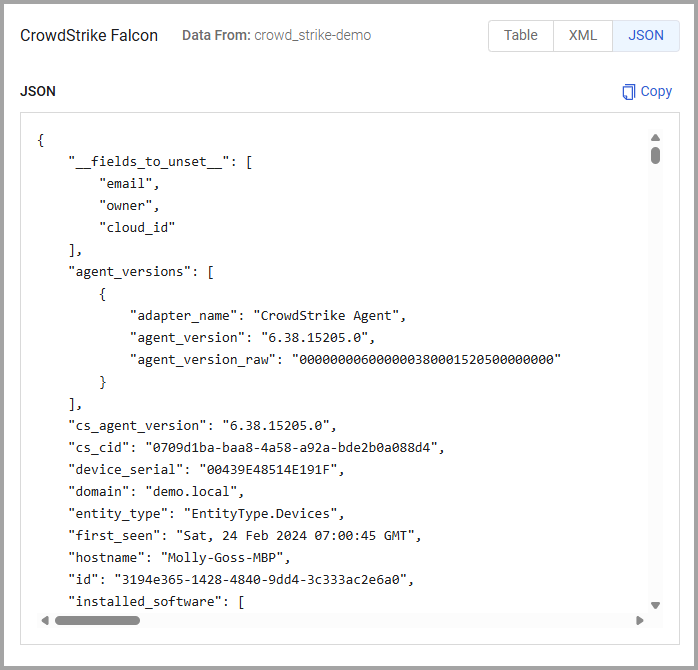
JSON - to see the raw data (Advanced view) as returned from the adapter, with unparsed data in JSON format.
-
Click XML to view all asset information in XML format.
- Click JSON to view asset information in JSON format.
-
Click
 to copy the JSON formatted data to the clipboard. This is useful for troubleshooting.
 -
Click Table to go back to the specific Adapter Connections page.
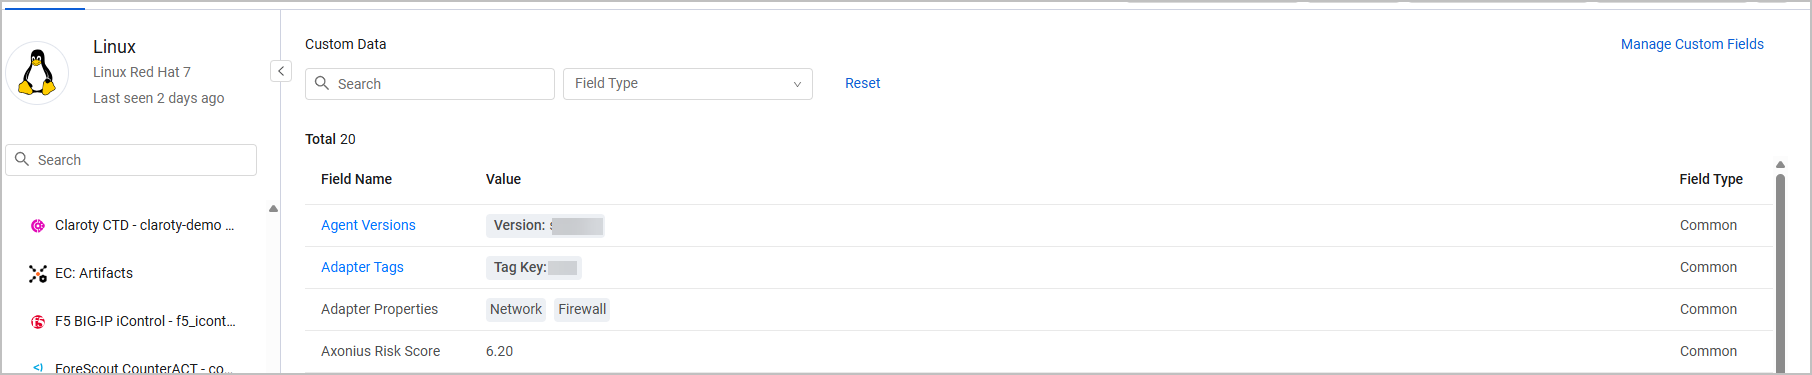
Managing Custom Fields
The Custom Data tab displays a list of all the custom fields for this device/user and their value. It displays fields created using Actions or added using Manage Custom Fields. Click Manage Custom Fields above the table to add fields to this asset, edit their values, or delete them.
For more details, see Working with Custom Data.
Note
The changes that you make here only apply to this asset, even if you added the fields to multiple assets from an assets page.
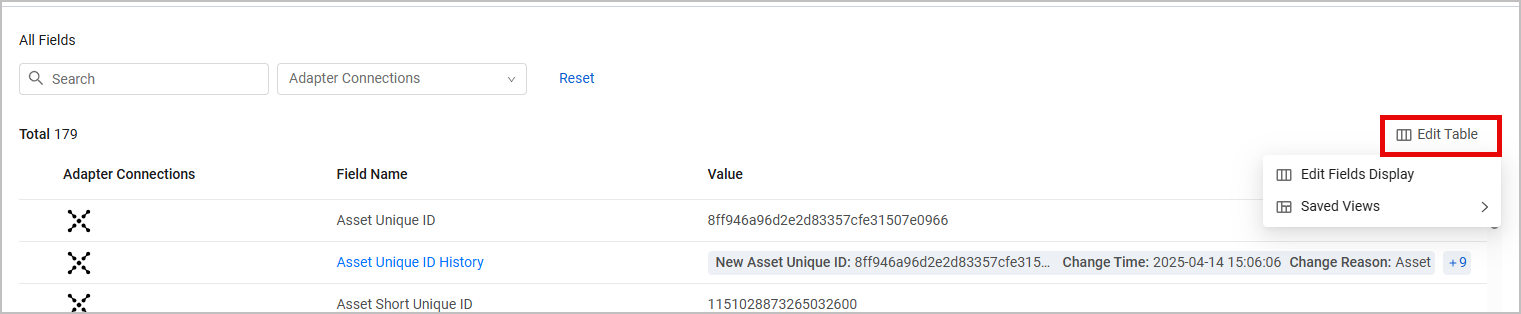
Editing Asset Profile Field Display
You can edit the All Fields view on the side pane to display only fields that are relevant to a specific scope of use case. Click the Edit Table button and select Edit Fields Display.
Notes
- Only Axonius users with admin permissions can edit the default All Fields view (System View).
- You cannot delete the default view.
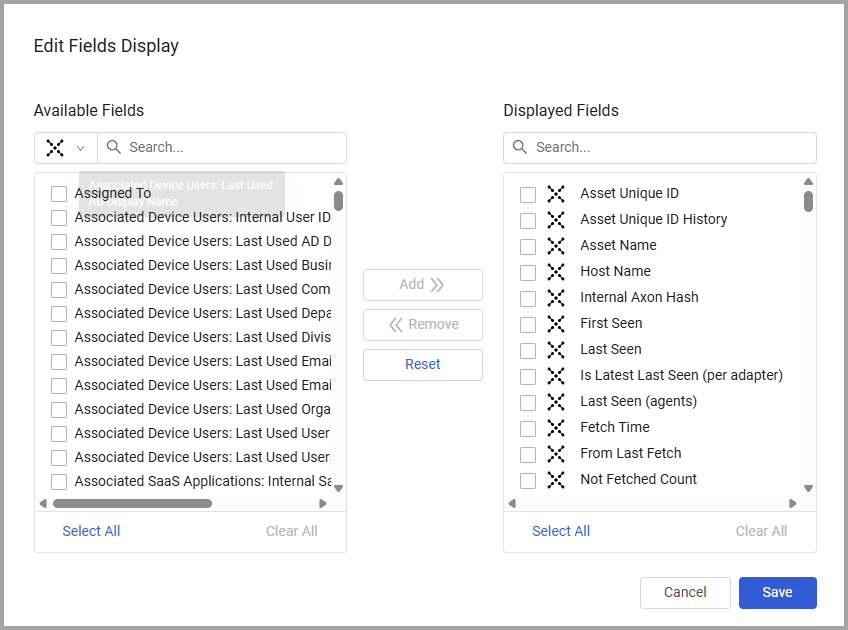
The Edit Field Display dialog opens. Its functionality is the same as the Edit Columns dialog from the Assets pages. Refer to Changing Columns Displayed for a detailed explanation on how to add and remove fields. When you finish editing, click Save to update the display.
Creating a New Saved View
Use saved views to create and save different table configurations. You can create a new view from scratch by selecting Edit Table > Saved Views > + New View.
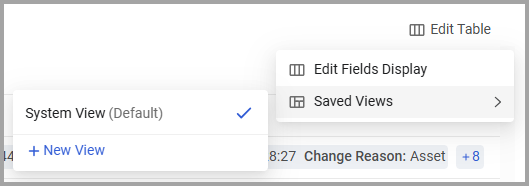
The New View dialog opens. Its functionality is the same as in the Assets pages, and you can set it as a default view, edit or delete it, and also share it with other users (roles). For more information, refer to Saved Views.
Note
Custom views created from the Asset Profile Page are only available to the user who created them. However, if an admin edits the default System View, the changes apply to all users.
Displaying Historical Data
Axonius saves daily “snapshots” of all the collected data, which you can view for any query on the Asset Profile page. This enables you to look at various assets for a specific date without having to go back to the relevant asset table to adjust the dates.
To view query results for a specific date, click 'Display by Date' on the top right hand corner above the Asset Profile table. 
A date picker control opens, enabling you to select the desired date. By default, the latest day for which data was collected is displayed. Note that you can only select one date.
Notice that only dates with collected data are enabled as options for choice. The system then displays the historical snapshot data of the page as it was presented on the date you selected.
To clear the historical view and set back to latest, hover over the displayed date and click the 'X' next to the displayed date.
Tabs
The Asset Profile page displays those tabs that have information on the selected asset.
Noncompliant CIS Controls Tab
Use Noncompliant CIS Controls to view CIS benchmark controls (rules) for all assets that are noncompliant. Use Search to drill down to results by Adapter Connection, Category, Control, or Section. Click a benchmark control to open the Control (Rule) Details drawer, which displays a detailed description of the benchmark control and its remediation. For more information, see Rule Details Drawer.
Location Tab
Use Location to display a building map with the device’s position marked, along with details such as device name, floor, and more. This tab appears only when location data is available.
Dashboards Tab
Use Dashboards to view Dashboard charts related to this specific asset, the asset type, and other related assets. Learn more on Asset Profile Dashboards.
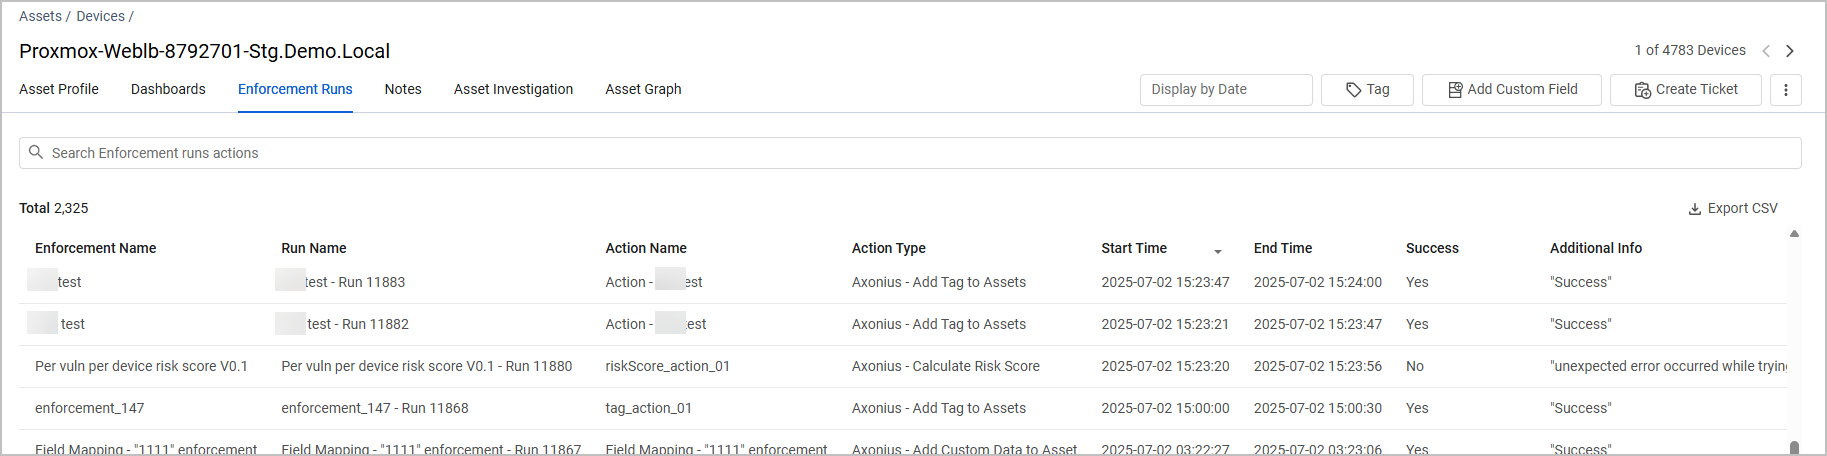
Enforcement Runs Tab
Use Enforcement Runs to view the list of Enforcement runs that were executed on the asset. Click the run name in the Run Name column to view run history details.
To learn more about Enforcements and descriptions of the fields in the Enforcement Runs table, see the following:
Note
The Additional Info column might display a message regarding the outcome of the Enforcement Run.
- In the case of success, a brief message is displayed.
- In the case of failure, further information about action failure or an action error message is displayed.
The maximum length of the auto generated message is 1000 characters.
Extended Data Tab
The Extended Data tab displays reserved information.
Tickets Tab
Use Tickets to view information on tickets that have been created for the asset in third-party ticketing systems, such as ServiceNow, using Enforcement Actions (see Create Incident Category) and track their progress. Learn more on how to monitor third-party tickets from within the Axonius application.
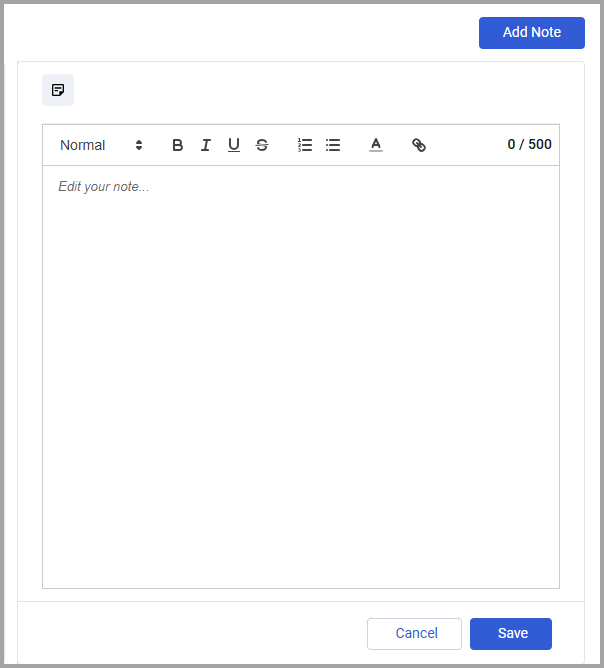
Notes Tab
Use Notes to add notes to assets, and view a list of custom notes about the asset, including the user who added the note and the time the note was added.
-
To add a note, click Add Note.
- Enter your note text and use the text editor to format your note and/or add hyperlinks.
- Click Save.
-
To edit a note, hover over it and click the Edit icon
 .
.- Use the text editor to format your note and/or add hyperlinks.
- Click Save.
-
To delete a note, hover over it and click the Delete icon
 .
.
The Note you enter is added to the Notes complex field. Use the Search bar to search for notes by their content, user, or Last Updated date.
Asset Investigation Tab
Use Asset Investigation to view details about how Assets change over time. The Asset Investigation tab shows information about changes to assets on your system. You can see changes over time, track specific assets and create a report of changed assets. To learn more about the Asset Investigation tab see Asset Investigation and Asset Comparison Report.
Asset Graph Tab
Use the Asset Graph to see a visual representation of the relationships between the assets in your environment and to investigate incidents. When accessed from the Asset Profile page, the graph opens centered on the current asset and its directly related assets. The sidebar shows each step in the investigation and you can filter what nodes are show on the graph to focus on those you directly want to see. To learn more about the Asset Graph, see Asset Graph.
Navigating Between Query Results
You can use the arrows at the top right of the drawer to navigate between query results.
Updated 21 days ago