
Comparing Today's Query Results to a Previous Date
This feature is available for the following chart types:
- Field Summary
- Query Comparison, including the Pie and Donut views
- Field Segmentation, including the Pie and Donut views
- Adapter Segmentation
Comparing Results
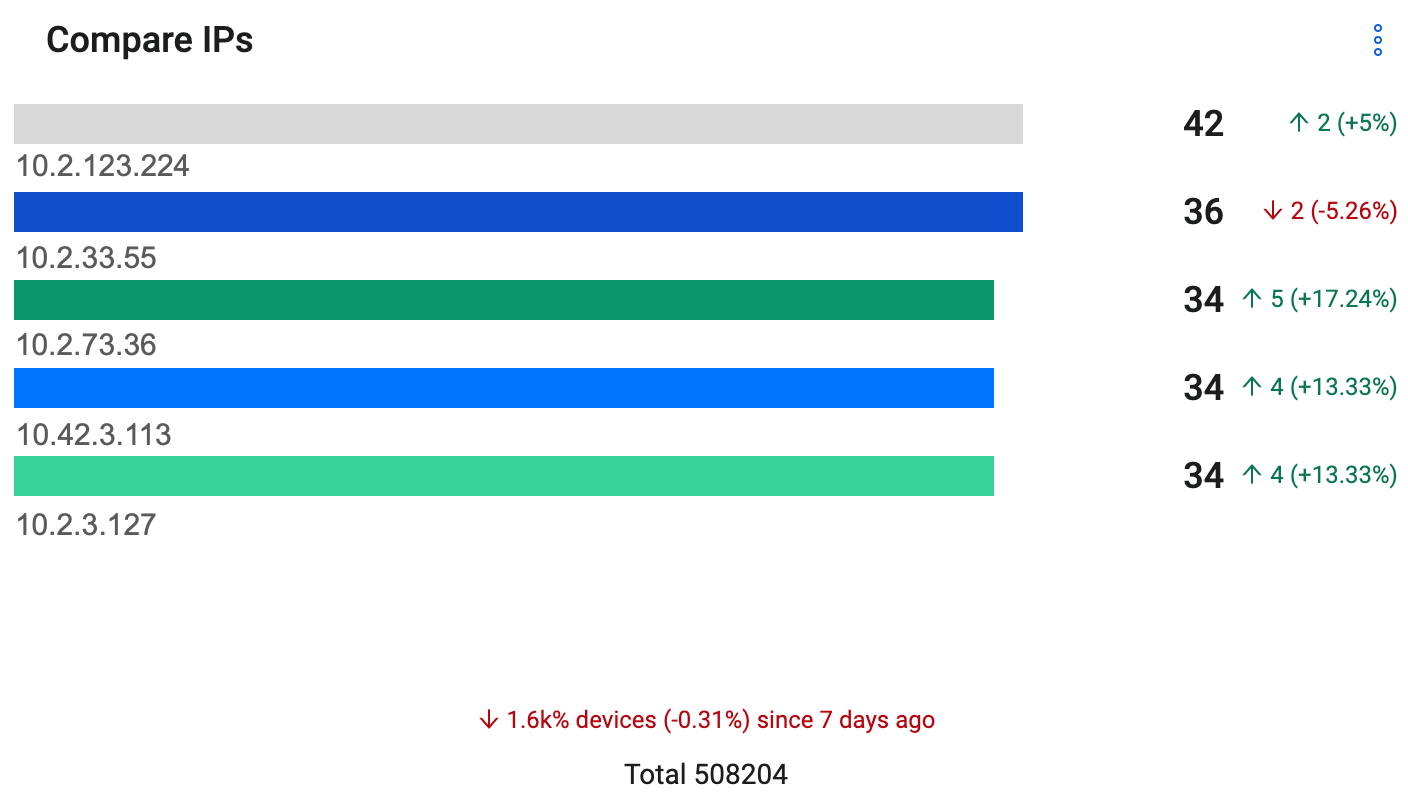
The Compare results feature allows you to compare today’s query results to results of a previous date. This gives context to the data and makes changes in the results more apparent. Changes are indicated by color as set in Change indicator color.
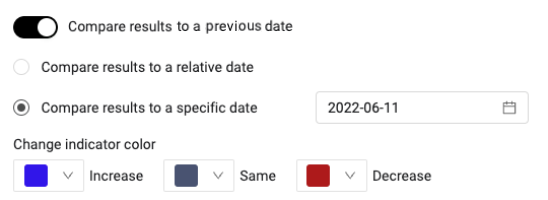
Toggle on Compare results to a previous date to compare today's results to a date relative to today or to a fixed date.
Color coding is applied to the asset count change indication to the right of the chart.
To compare today's results to results of a previous date:
- Choose one of the following:
- Relative date before - Enter a value in the text box and then select the time unit: days, weeks, months or years. Today’s results are compared to results of a relative date for which there is data.
- Specific date - Use the date picker to select a specific date. Today’s results are compared to results of a specific date for which there is data.
-
In the Change color indicator section, select colors for the following:
- Increase - There are more results today than on the comparison date.
- Same - There are the same number of results today as on the comparison date.
- Decrease - There are less results today than on the comparison date.
Comparing Pie and Donut Charts
Use the comparison in the Pie and Donut views of the Field Segmentation and Query Comparison charts to see how the size of each slice changed since a previous date.
Permissions: To add a chart, you need the Dashboards > Charts > Add permission. To edit a chart, you need the Dashboards > Charts > Edit permission.
To compare a pie or donut chart to a previous date:
- Add a Field Segmentation or Query Comparison chart, or edit one.
- In Visualization, select Pie or Donut.
- Select the module, the query, and the field or queries.
- Enable Compare results to a previous date.
- Select Relative date and enter the time before today, or select Specific date and select a date.
- (Optional) In Change indicator color, set the colors for Increase, Same, and Decrease.
- Click Save.
- The default comparison date is a relative date of 7 days before.
- Each legend row shows the change of its slice next to its count: an arrow, the change in assets, and the change in percent. For example: 120 (25%) or -50 (-11.11%).
- The arrow and the numbers use the Increase, Same, or Decrease color.
- The tooltip of a slice also shows the change. When Show legend is disabled, the change appears only in the tooltip.
- No change appears when the comparison date has no data.
- The comparison isn't available for the Pie and Donut views of the Pivot chart and the Query Intersection chart, or for modules that have no historical data, for example Activity Logs.
Example: A Field Segmentation Pie chart shows devices by OS: Type, compared to 7 days before. The Windows row shows 600 and an up arrow with 120 (25%). The Linux row shows 400 and a down arrow with -50 (-11.11%).
Sorting Bar Charts by Change
Use Percentage to sort the bars of a chart by how much they changed since the comparison date, so the bars with the largest change appear on the first page.
Permissions: To add a chart, you need the Dashboards > Charts > Add permission. To edit a chart, you need the Dashboards > Charts > Edit permission.
To sort a bar chart by change:
- Add a Field Segmentation or Query Comparison chart with the Bar view, or edit one.
- Enable Compare results to a previous date.
- Select the previous date, as a relative time or a specific date.
- In Sort by, select Percentage.
- In the second list, select Descending or Ascending.
- Click Save.
- Percentage appears in Sort by only when Compare results to a previous date is enabled.
- Descending puts the bars with the largest increase since the previous date first. Ascending puts the bars with the largest decrease first.
- The default sort is Value, Descending.
- When you disable Compare results to a previous date, a Percentage sort goes back to Value, Descending.
- Adapter Segmentation bar charts also list Percentage in Sort by when the comparison is enabled.
- Pivot chart bar charts don't have the Percentage sort.
- The comparison isn't available for some data sources, for example Activity Logs. For these, Percentage doesn't appear.
Example: A Field Segmentation Bar chart shows devices by OS: Type, compared to 30 days ago. Select Sort by > Percentage > Descending. The OS types that grew the most appear first.
Updated about 11 hours ago