
Queries Page
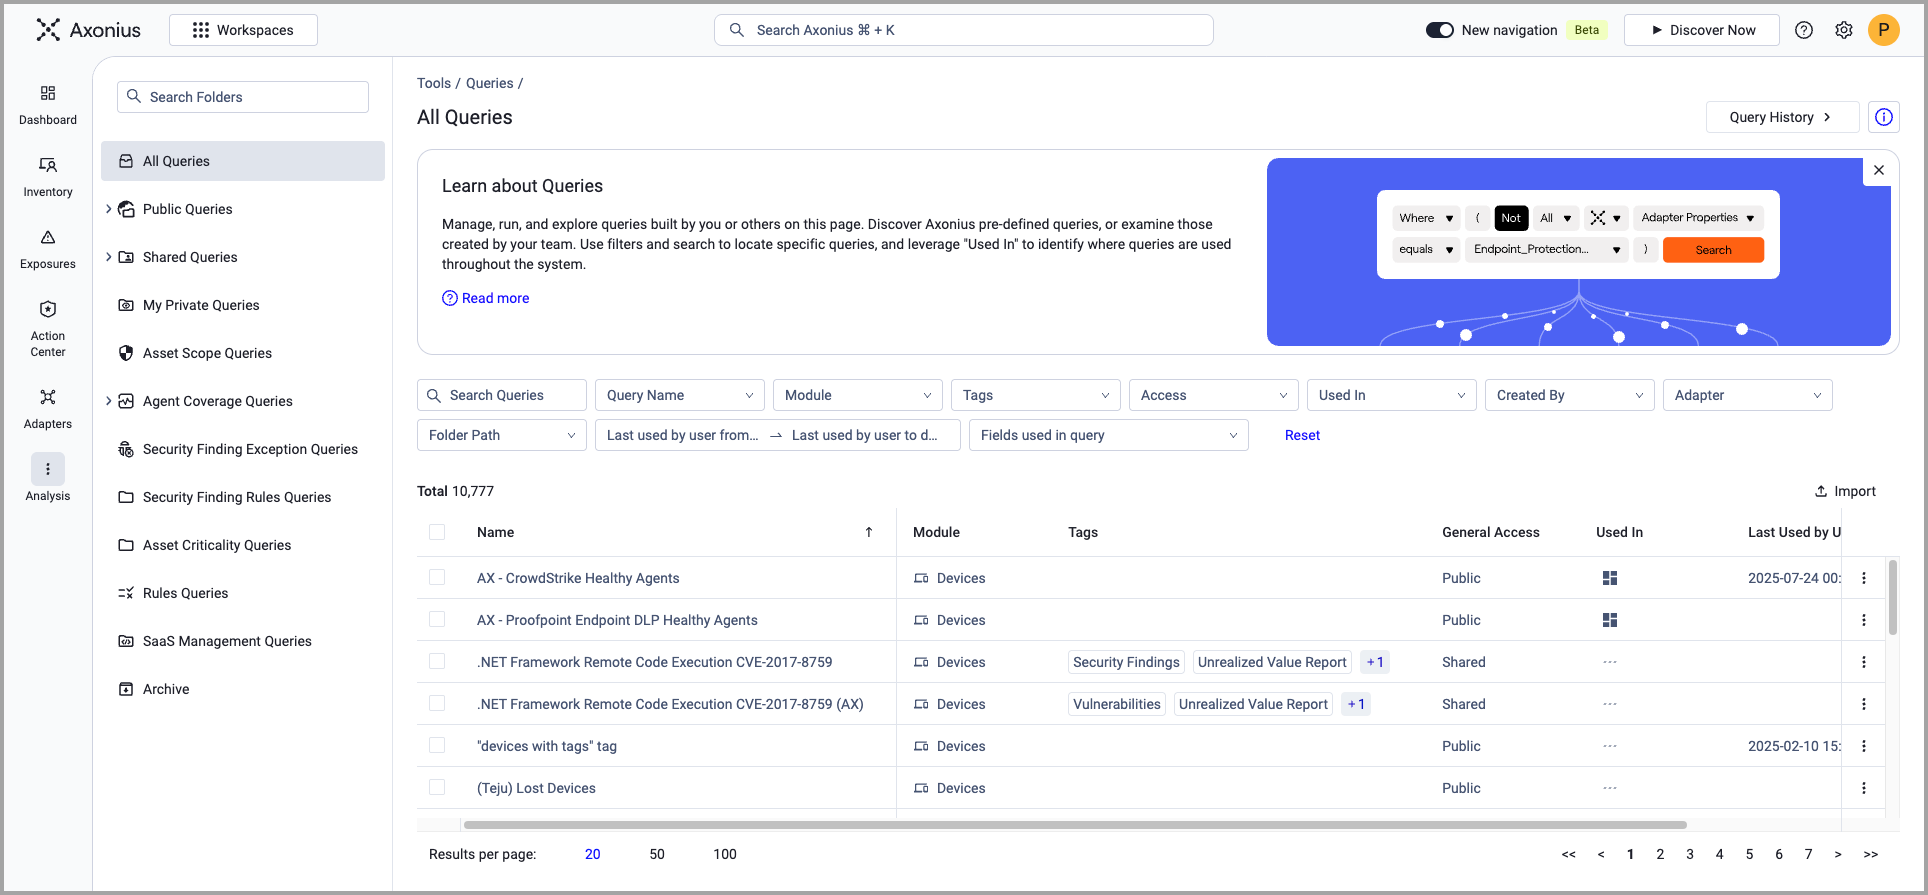
Use the Queries page to manage the queries in your system. You can see a centralized summary of information about all saved queries in the system, manage all queries, see who updated a query, view when a query was last used, and more. To open the Queries page, click the Queries icon. The Queries page opens.
In Axonius New Navigation Experience access Queries from the Analysis menu.
Queries are organized in folders. The Folders pane is shown on the left side of the page.
See Managing Queries for more information about using the Folders pane.
When you save a query, the access permission you configure and the folder you select determine its folder location.
See Managing Queries for more information.
The total number of saved queries in the selected folder is displayed on the top left side of the table:

A link to Query History is displayed at the top of the page. Click Query History to see information about queries that were run in the system. Right click Query History to open it in a new tab.
The following information is displayed on the Queries page.
-
Name - The name of the saved query.
-
Module - The system modules on which the query runs, which include: Devices, Users, all asset types as well as Activity Logs, Adapters Fetch, Asset Investigation - Devices/Users etc.
-
Tags - The tags associated with the saved query, if these exist.
-
Access - The access permissions for the saved query.
- Private - Only the user can view this saved query.
- Public - All users can view this saved query. It can be used in all Dashboards, Enforcement Center, Reports, Query Wizard etc.
-
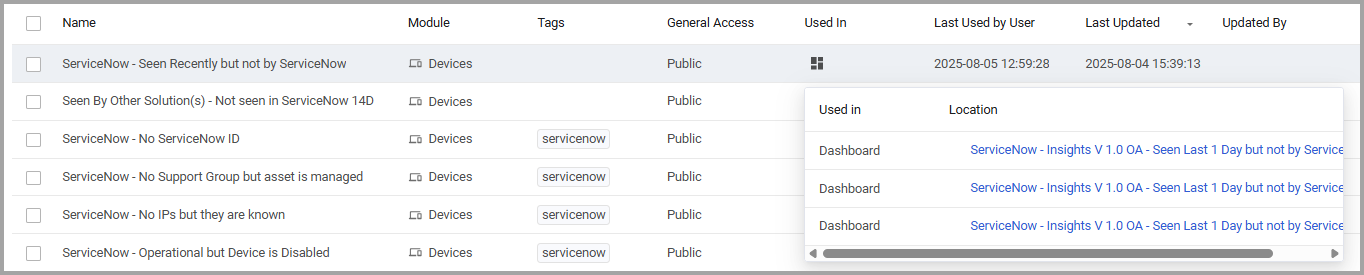
Used In - One icon is displayed for each component type in which the Query is used. For example, Dashboards, Queries, Enforcements, and Findings. Hover over the icons to open a table showing each component that uses the Query and a link to where it is used.
In this way, you can see where the queries are used and decide whether you can delete the query from the system or what will be affected if you edit it. The Used In table displays two columns:- Used in - Component type that uses this query.
- Location - Component name link. Click the link to open a new tab in the configuration page of the component that uses this query. For example, clicking slack_001 opens the configuration screen of Enforcement Set slack_001 with main Enforcement Action: Slack - Send Direct Message to Assets.
Note
Used In is available for all users.
When a query is used in a location that the user doesn't have permission to access, a message indicates the number of times the query is used in restricted locations.
-
Last Used by User – The last time the query was run by any user manually.
-
Last Updated - The date and time the saved query was updated.
-
Updated By - The user who made the last update to the query.
- The username is displayed with a prefix:
- Internal - A user who was defined internally in Axonius by one of the system admins.
- SAML or LDAP - A user who logged in using the LDAP or SAML based login options.
- If the user no longer exists in the system, the displayed username is displayed with a “(deleted)” suffix.
- Hover over the field to display the user's first and last names in addition to the user name, if this exists.
- For predefined saved queries, which were preconfigured by Axonius, the Updated by value is Predefined.
- Folder – The folder that stores the query.
- The username is displayed with a prefix:
-
Created by – The name of the user who created the query.
-
Folder Path – The path where the saved query is stored. If the path is long, and not fully displayed, hover over to see it.
When you click a query, the Saved Query drawer opens. Refer to Viewing and Editing Query Details to learn more about the Saved Query drawer. You can select Run Query to run the query.
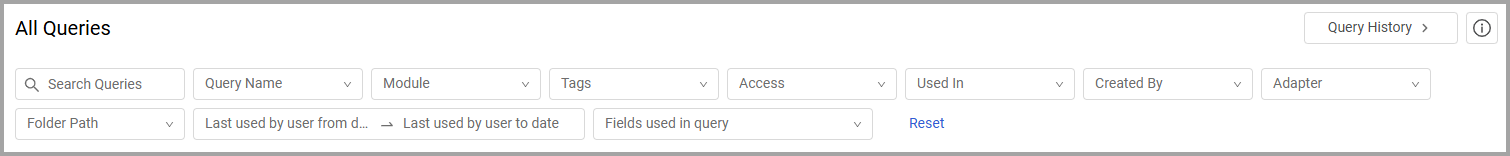
Search and Filter Saved Queries
You can filter the queries as follows:
-
Search Queries - Enter free text to search for Queries by query name.
-
Query Name - In the Query Name search box, type all or part of the Query name, and then from the list of Queries containing the string entered, select the relevant Query name. Once you start typing up to 150 items are displayed.
-
Module - Select one or more system modules on which the query runs. The system returns all relevant queries.
-
Tags - Select one or more tags from a list of all the tags associated with the saved queries to filter the display by tags. All saved queries tagged with at least one of the selected tags are displayed. Click Clear All to clear all selections.
-
Access - Select an access type to filter the display by access type. All queries with the selected Access Type are displayed. Click Clear All to clear all selections.
-
Used In - Select a component type to filter the display by component. For example, Dashboards, Queries, Findings, Enforcements.
-
Created By - Select one or more users. The system returns all relevant queries.
-
Adapter - Select one or more adapters to filter. The system returns all relevant queries using the selected adapters.
-
Folder Path - Select one or more query paths inside the parent folder.
-
Last used by user from date - Last used by user to date - Click the Date Range picker to filter the date queries were run by.
- Select two dates to set the date range for which queries will be displayed.
- To filter queries only for a specific date, select the same date twice.
- Click Select Time in the date range picker to include specific times in the date range.
- Click OK to set the Date Range filter.
-
Fields used in query - Click to filter queries by the field name in use in the query expression.
- Select an asset type from the dropdown list, or start typing to find the desired asset type.
- Select an adapter from the adapter dropdown list.
- Select one or more field names from the dropdown list or start typing to find the desired field name in the saved queries.
Note
The list is a multi-select list. You can select fields of multiple asset types and adapters to filter by.
- All saved queries that have at least one of the selected fields from the list are displayed in the table.
Note
The filter doesn’t include results from Internal Queries modules.
Click Reset to clear the search and filters.
Sorting Queries
You can sort queries to see where they are used. Click a column title to sort by title.
Importing Queries
You can import one or more queries from another system. Refer to Importing and Exporting Queries.
Saved Query Actions
Deleting Queries
To delete queries
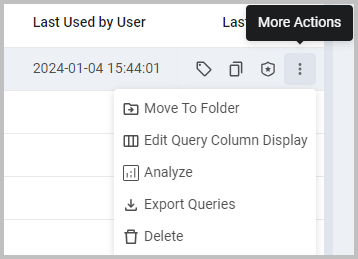
- On the Queries page, hover over a query or select one or more queries. The More Actions menu is available.
- From the More Actions menu, select Delete to delete one or more queries.
Or delete queries from the Saved Queries drawer.
Tagging Queries
You can add tags to one or more queries. You can't tag predefined queries; only queries created by users.
-
On the Queries page, hover over a query or select one or more queries.
-
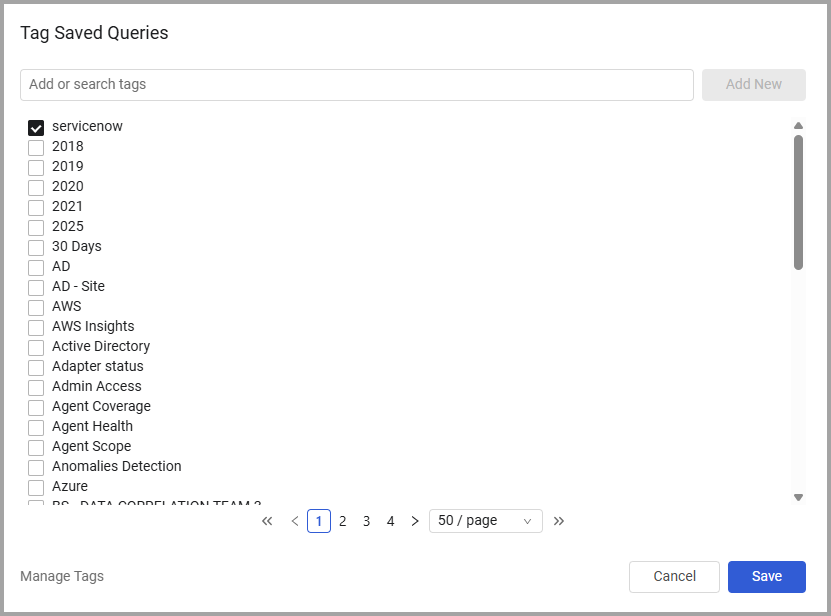
Select Tag to tag one or more queries. The Tag Saved Queries dialog opens.
-
Select a tag from the dropdown list of tags available in the system, or start typing to add a new tag. The list of tags used in queries is the same across the entire system. When you add a new tag, click Add New to add the tag to the system.
.png)
-
Click Save.
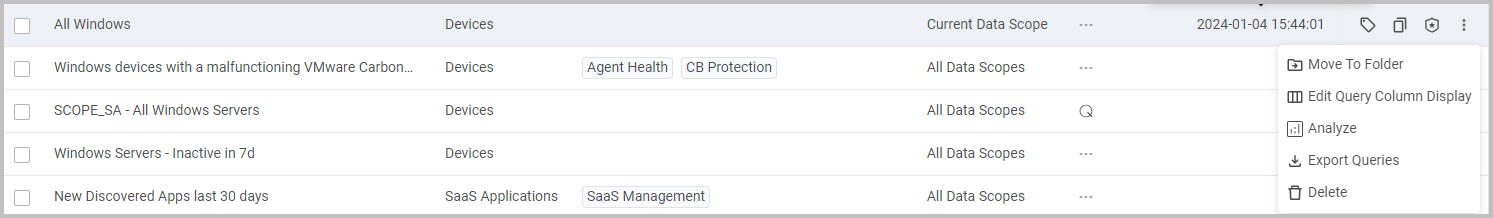
Moving to a Folder
You can move one or more queries to a different folder.
Editing the Query Column Display
Your system comes with a set of predefined columns in each asset table, which determines the columns that are displayed on the asset page and asset list view. The Column view is set on each asset page separately and displays columns appropriate for that asset.
You can edit the columns displayed for a group of queries. Note that you can also edit the Query column display for a single query, from the relevant asset page. Refer to Changing Columns Displayed.
- Hover over a query or select one or more queries. They should be queries on the same module.
- From the More Actions menu, select Edit Query Column Display. The Edit Columns dialog opens.
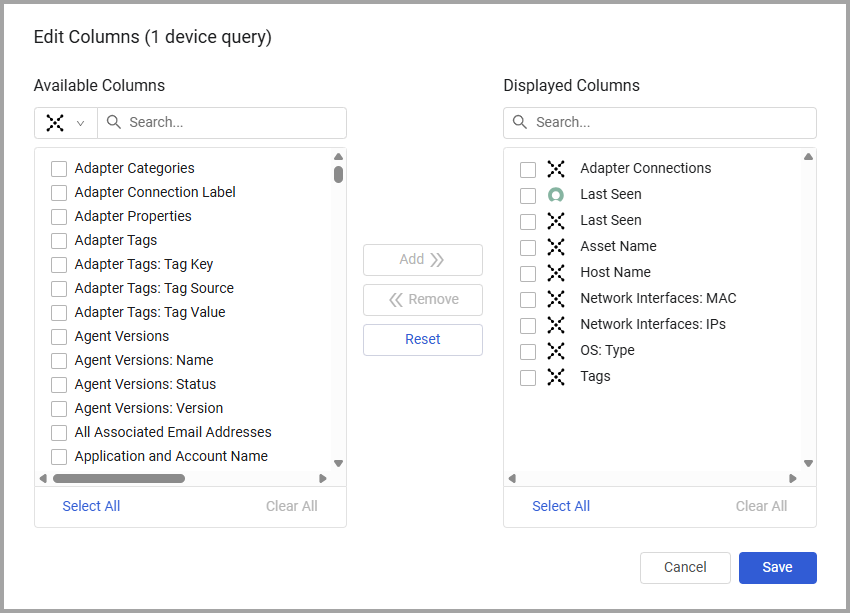
- Select the fields you want to add, and click Add.
- Alternatively, select the fields you want to remove from the display and click Remove. Editing columns overrides the existing columns displayed in these queries and any data refinements set for the columns, and sets a new columns display.
The columns you selected are now saved as part of the queries you selected. The Query drawer displays the columns that are displayed as part of the saved query.
Creating an Enforcement Set
You can create an enforcement set directly from a query.
- Hover over a query or select a query.
- Select Create Enforcement Set.
The Enforcement Set Configuration page opens. For more details, see Creating Enforcement Sets.
Duplicating Queries
If you want to work with or create similar queries, you can duplicate queries either from the Queries page or from the Query Drawer.
From the Queries Page
- Click the Queries icon on the left navigation panel. The Queries page opens.
- Hover over the query you want to duplicate or select a query to duplicate.
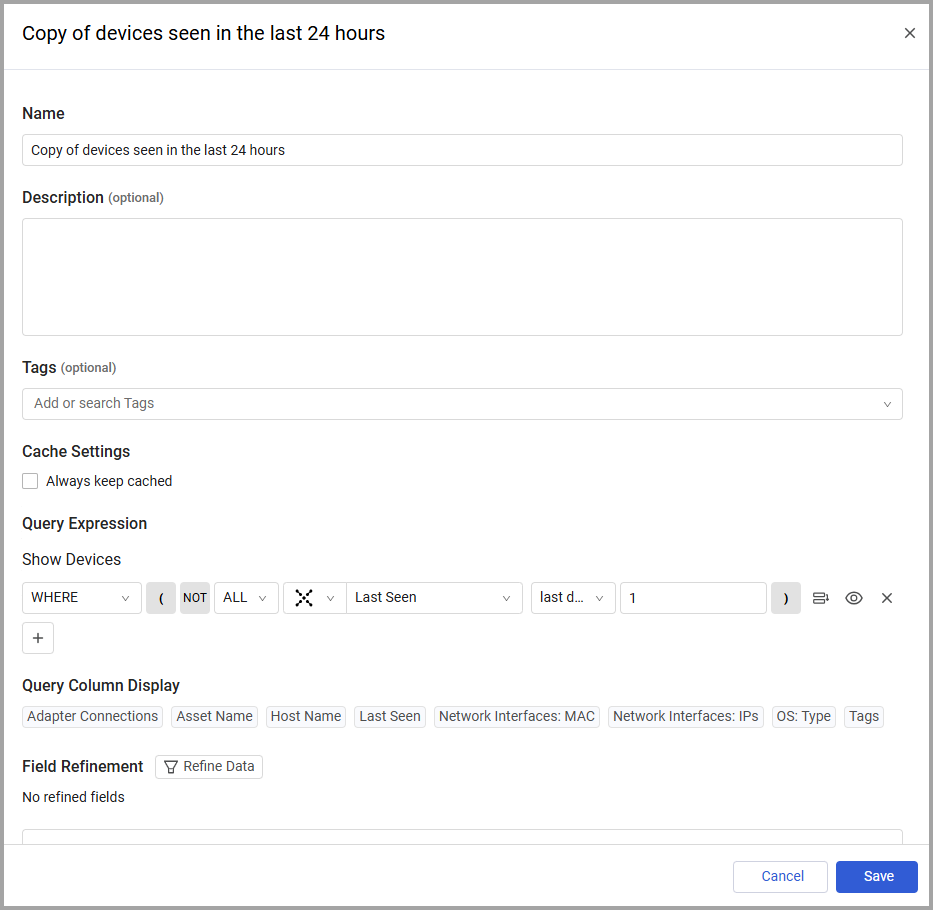
- Select Duplicate. The Copy of Query Name dialog opens.
-
Edit the query as required.
-
Click Save. The Query drawer opens in review mode.
-
Click Run Query to run the new query. The new query now appears in the Queries page.
From the Query Drawer
You can also duplicate a query from the Query Drawer.
- From the Queries page, click a query that you want to duplicate. The Query Drawer opens.
- From the top row, click
 . The Copy of Query Name dialog opens.
 - Edit the query as required.
- When done, click Save. The new query is saved.
Exporting Queries
You can export one or more queries. Refer to Importing and Exporting Queries.
Viewing and Editing Query Details
Use the Saved Query drawer to view query details, edit them, and perform actions on the query.
On the Queries page, click a saved query record to view its details; the Saved Query drawer opens. When you open a query saved in AQL format, it is displayed in the Query Wizard in AQL format. You can view and edit the following saved query details:
Click  to edit the following query details
- Name
- Description (optional, limited to 300 characters)
- Tags
- Always keep Cached
- View the following saved query details:
- Query Wizard expressions
- Last updated
- Updated by
Viewing Saved Queries
When a saved query is based on one or more saved query, you can see the details of the saved query. Hover over a saved query nested in another query. An expand arrow is displayed.
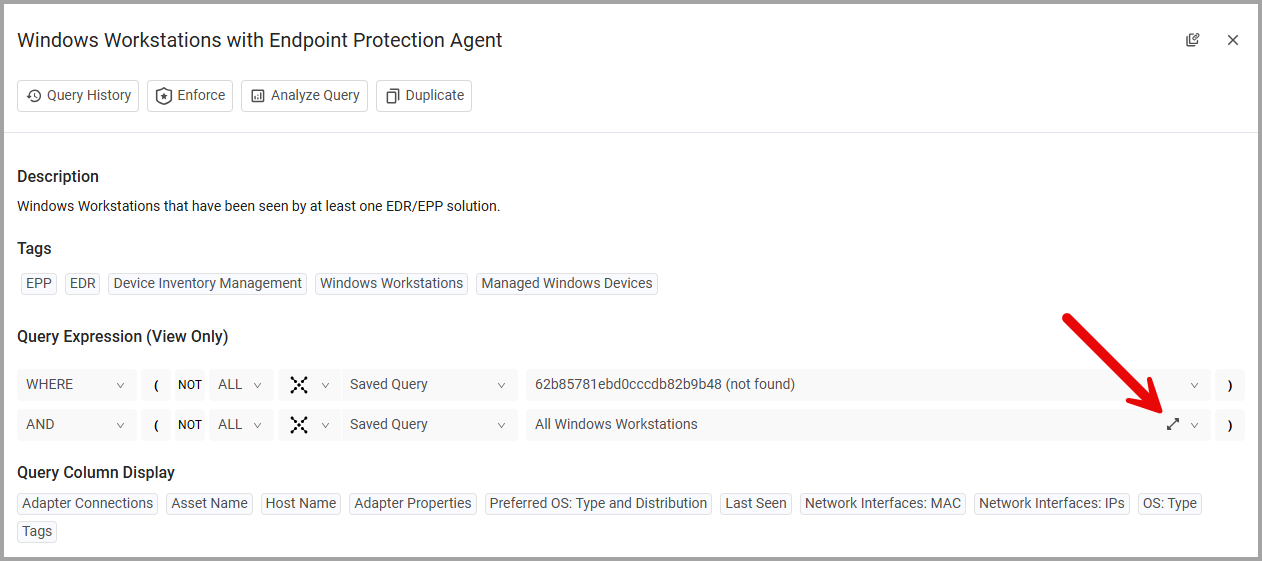
Click the expand arrow. The details of the nested saved query are displayed.
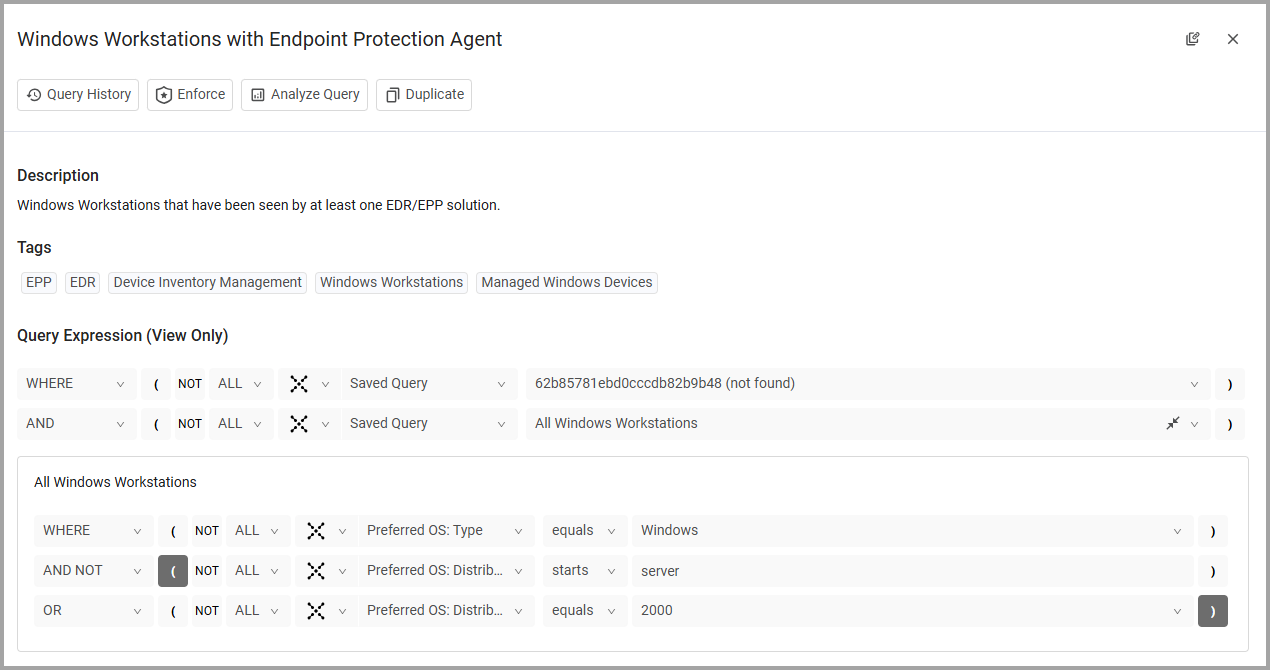
You can continue to expand nested queries as required. The number of queries which can be expanded may depend on screen size and resolution. A message is displayed when you can't expand any more queries. You can use the arrow to collapse the query display.
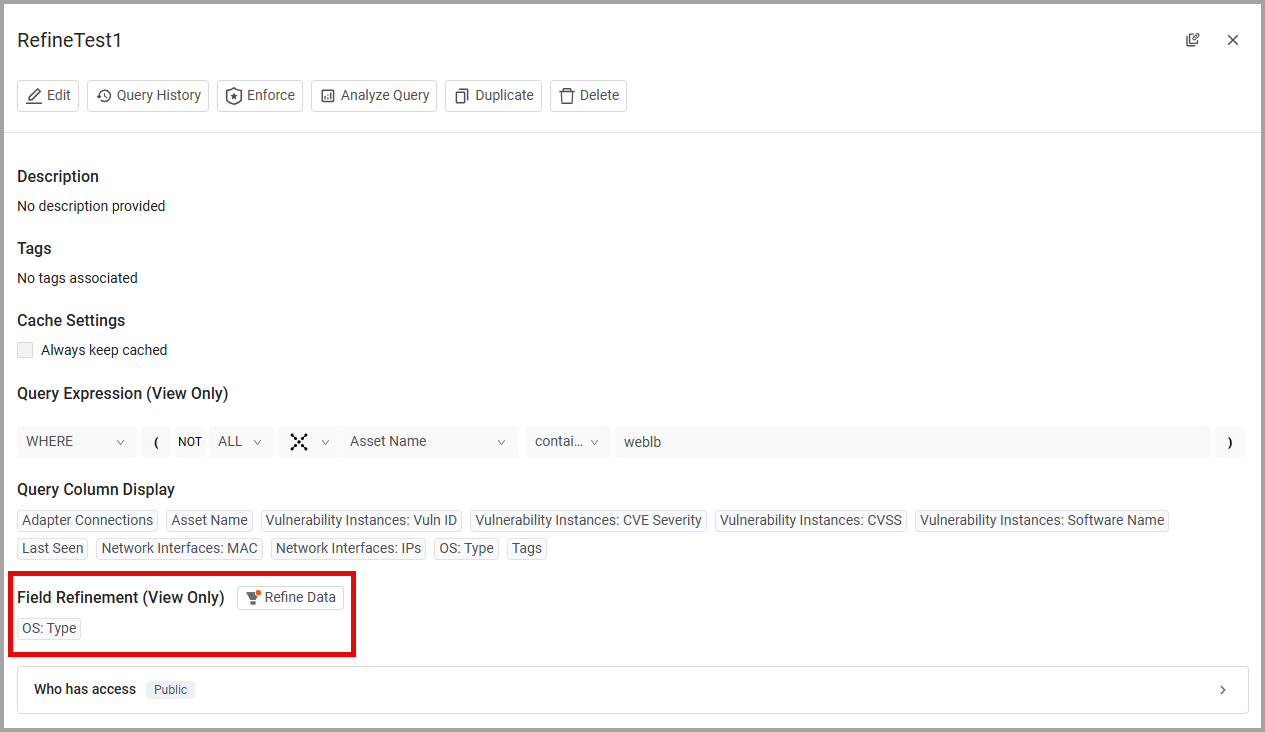
Refining Data from a Saved Query
When a saved query contains refined data, a Field Refinement section appears on the Saved Query drawer, detailing the criteria (field values or adapter connections) the data is refined by. Click Refine Data to access the Refine Data Dialog and see all the details. To edit Field Refinement from query drawer, the drawer must be in editing mode.
Refer to Refining the Data Displayed in Table Columns and Rows for a detailed explanation on data refinement.
Actions on Saved Queries
In addition, you can perform the following actions:
-
Click
 Run Query to run the query and display the results in the asset page.
 -
Click
 to open the query history runs of this query in the Query History page.
 -
Click
 Copy Query Link to copy the link to the query and share it with others.
 -
Click
 New Enforcement to create a new Enforcement Set using the saved query to select the assets. The Enforcement Set Configuration page opens. For more details, see Creating Enforcement Sets.
 -
Click
 Set access to public on private saved queries to set the access to public. Changing the access of a saved query to public makes it publicly available to all users and cannot be reset to private.
 -
Keep saved query always cached - The Keep always cached checkbox lets you keep a saved query always cached.
- If enabled, the saved query will always be cached. The saved query will be executed and cached at each TTL interval defined in Cache Settings.
- If disabled, the saved query will not be always cached.
- This checkbox is only visible when Caching is enabled in the system.
-
Click
 Delete to delete the saved query.
Analyzing Query Results with Data Analytics
You can run a query and analyze the results in the Data Analytics page.
- Hover over a query or select a query, and then from the More Actions menu, select Analyze. The query is run and the results opened in the Data Analytics page. See Analyzing Query Data - Creating Data Analytics Reports to learn more about using the Data Analytics page.
For general information about working with tables, refer to Working with Tables.
Updated 1 day ago