
Using Dashboard Templates
Axonius provides a set of preconfigured Dashboard templates, covering the most common scenarios to provide you with relevant insights about your environment quickly.
A template is a Dashboard that contains a group of useful charts around a common theme. The charts in the Dashboard were built based on Axonius’ wide experience with the dashboards that customers with interests similar to yours are likely to build. The charts are preconfigured with saved queries. Once the appropriate adapters are connected and a Discovery Cycle run, the charts will display system information.
Creating a Dashboard from a Template
- On the Dashboard page, from the Add Dashboard list, select Dashboard Templates.
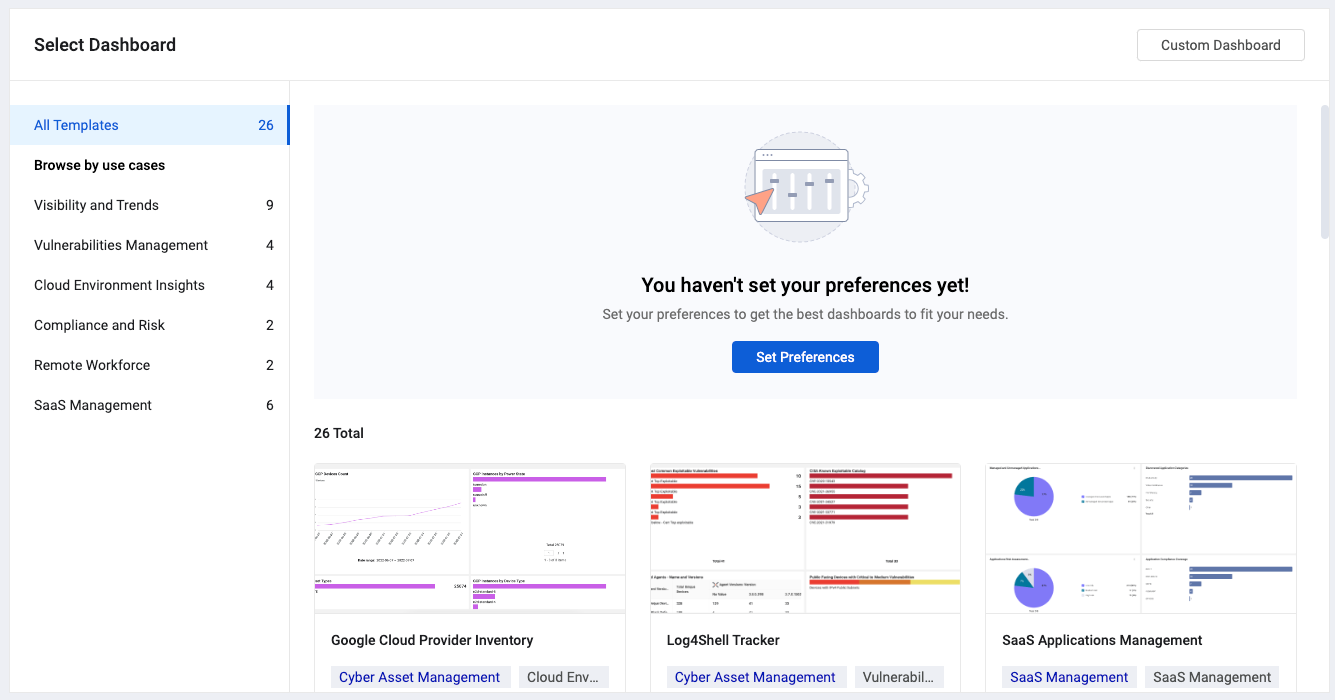
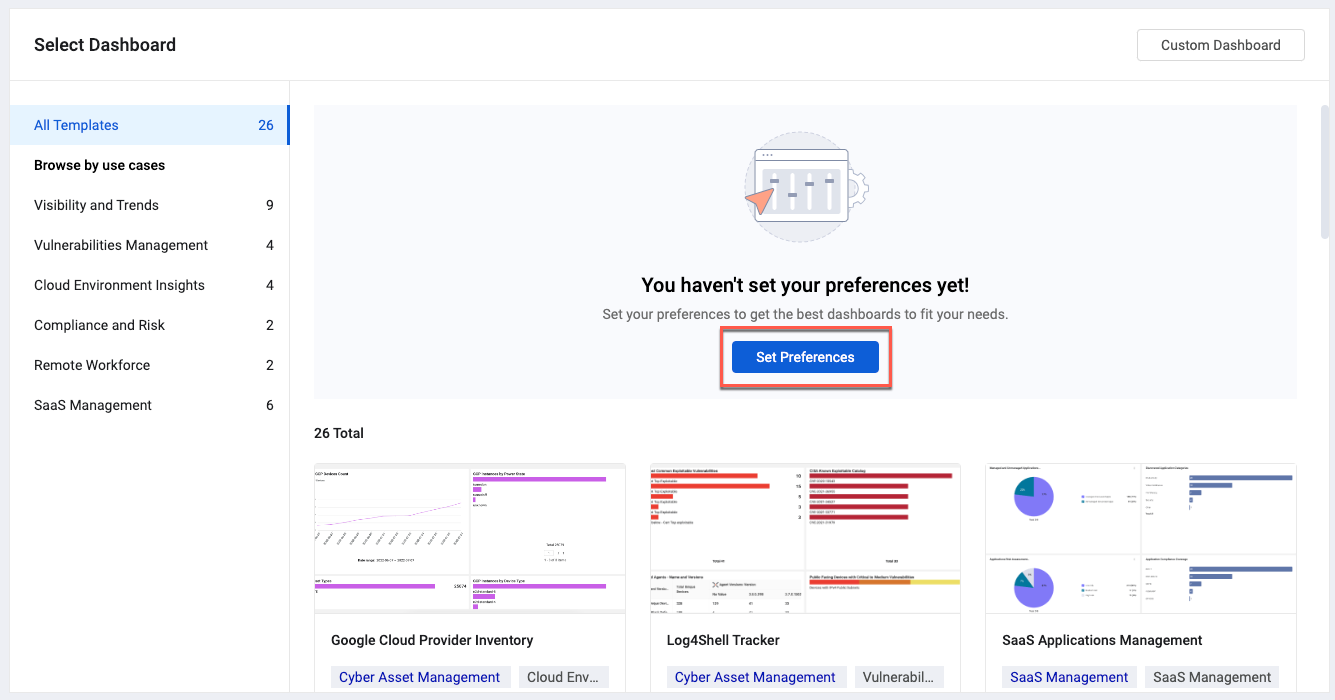
- The Select a Template page is displayed, showing templates that match your preferences.
Note
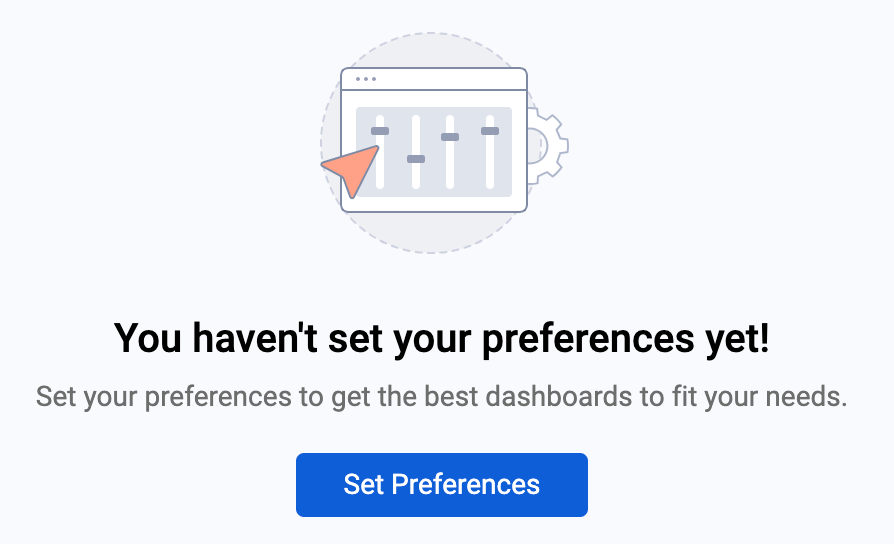
If you have not yet set your preferences, the system gives you another opportunity to do so. See Setting Preferences.
You can either browse through the recommended templates to select a template, or choose Custom Dashboard in the upper right-corner to create a new empty Dashboard. You can add charts to this Dashboard as explained in Adding a Custom Chart to a Dashboard.
You can also browse templates organized by use case categories listed along the left side of the template selection pane.
When you mouse over a template, Preview and Select are available.
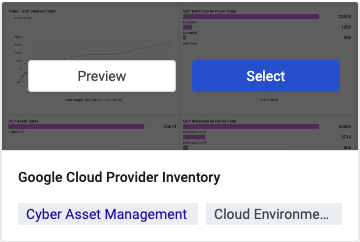
- Click Preview to view an example of the template. See Viewing a Template Preview.
- Click Select to create a Dashboard based on the template.
Viewing a Template Preview
You can view a preview of any template to get an idea of the type of information and charts it provides before selecting it.
To view a preview of a template:
- When hovering over a template tile, click Preview; the Template preview opens.
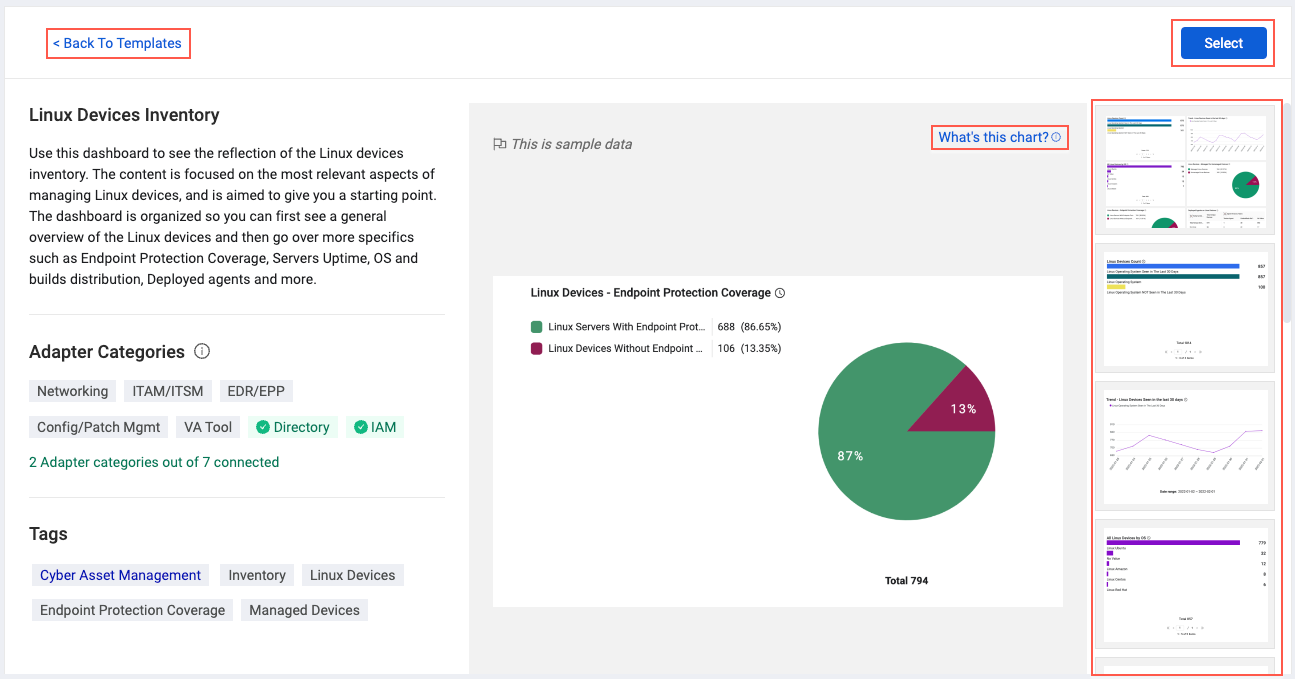
The left pane displays the name of the template, a description about what it provides, the Adapter categories from which adapters can be connected in order to populate the data, and any tags that are set. Connected Adapters are indicated in green with a checkmark.
On the right is a scrollable pane that displays a thumbnail of the charts included in the template.
- Click on a chart to see a screen capture with sample data in the center pane.
- Click What's this chart? to see a more detailed description of the chart.
- Click Back to templates to see more templates.
- Click Select in the upper right corner to use this template.
Fine Tuning the Dashboard
Once you create a Dashboard using a template, you can click Edit Chart from the chart's 3-dot menu to see the query that was used to create the chart. At first use the template as is. You can later fine-tune and edit queries to make your own set of charts based on the template. Note that you cannot edit pre-defined queries. Duplicate a query to edit it, and then update your chart. Once you create a Dashboard from a template, the changes you make to it do not affect the source template.
Connecting More Adapters
In the Dashboard you create, if a category does not have adapters connected from it, you can see the list of the missing categories and you can click Connect Adapters to open the Adapters page filtered to the relevant category.
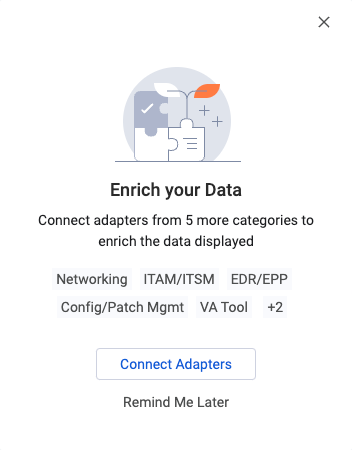
Click Remind Me Later to have this widget appear again as a reminder to connect more adapters. Click the X in the upper right corner to close the widget and it will not appear again.
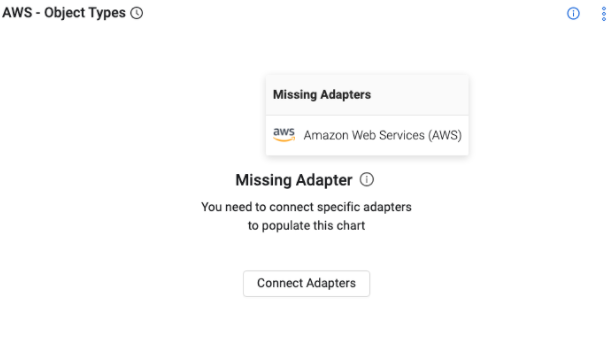
In addition, if a particular chart requires a specific adapter which is not connected, click Connect Adapters to see a list of relevant adapters on the Adapters page.
Note:
The solutions that the Axonius Cybersecurity Asset Management integrates with are called Adapters. Adapters are divided into categories. You can use categories to help you decide which additional adapters you can connect, and to easily find adapters relevant for your use case. The more adapters you connect, from as many different categories on the system, the more information you can display.
Setting Personal Preferences
You can set personal preferences and have the system display dashboards and adapters that suit your needs. Axonius will ask you to fill in some information about yourself.
- On the Select a Template page, click Set Preferences.
- Select all the checkboxes relating to information that interests you.
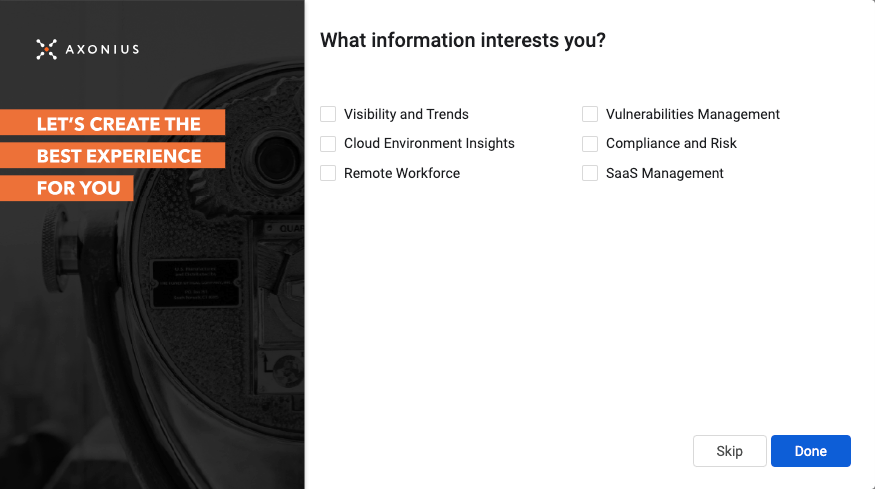
- Click Done.
- If you do not fill in your preferences now, you can fill them in at any point later on during your use of Axonius.
Updated 7 months ago