
Connecting the Network Inspector to Your Network
The Axonius Network Inspector device must be connected to your network and monitored.
Connection Steps
- Connect the device management port to your network using an Ethernet cable with an RJ-45 connector.
- If you selected DHCP for the management port IP address, identify the assigned IP address using one of the following methods:
- Method 1 - Connect a monitor and keyboard directly to the device and press Enter. The assigned IP is displayed on the prompt screen.
- Method 2 - Check your DHCP database for the IP address, using the device MAC address for reference (shown in the Setup Wizard).
.png)
- On a PC within your network, open a browser and enter the management IP address using the
https://<management IP>:8080format, with the specific IP address that you designated in Step 1 or that was assigned by the DHCP server. - Log in to the application using the username and password provided by your account manager. The management dashboard is displayed.
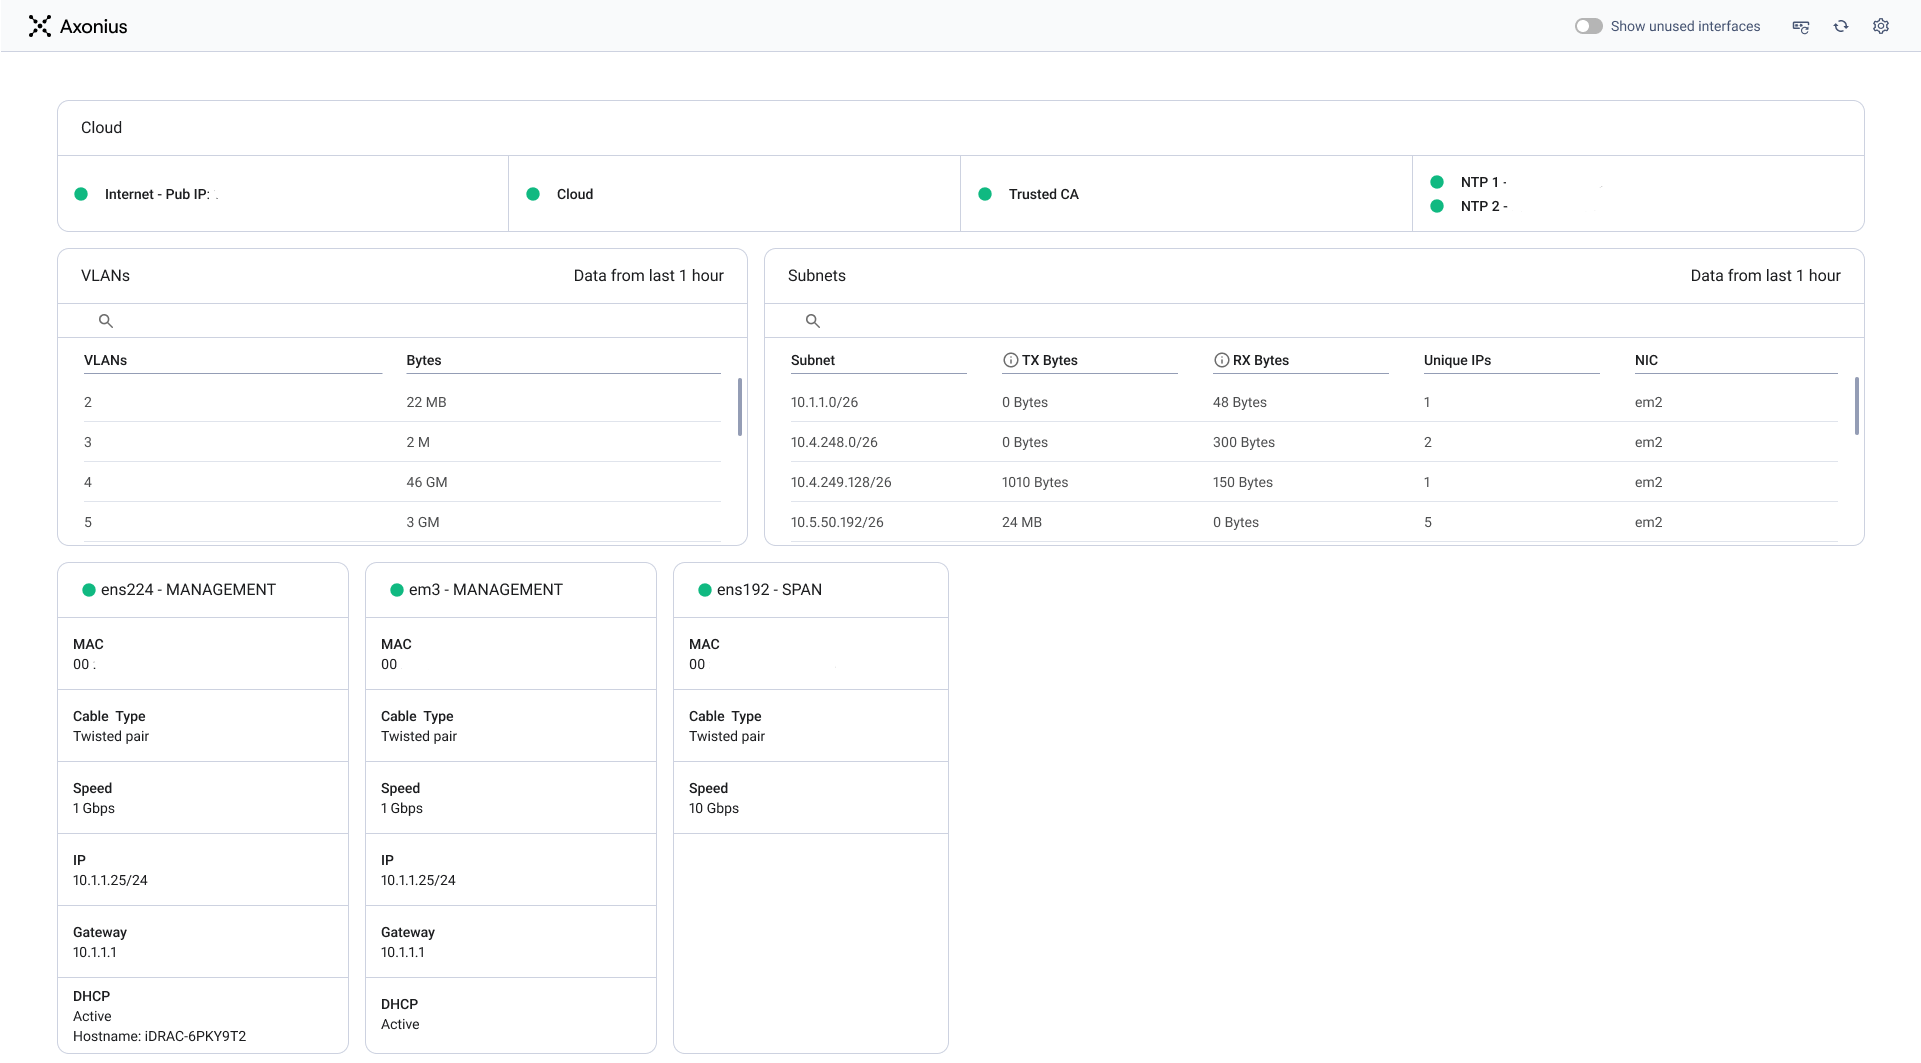
- On the top left panel, verify that all of the indicator lights are green or yellow, but not red.
Note
The system can operate normally even if it has cloud connectivity but lacks general internet connectivity. In this scenario, the internet connectivity indicator is yellow, signifying a non-critical issue that does not prevent core functionality.
If any of the status indicators are not green, you can click on them to view a tooltip. The tooltip provides details about the error and suggests possible mitigation steps to resolve the issue.
.png)
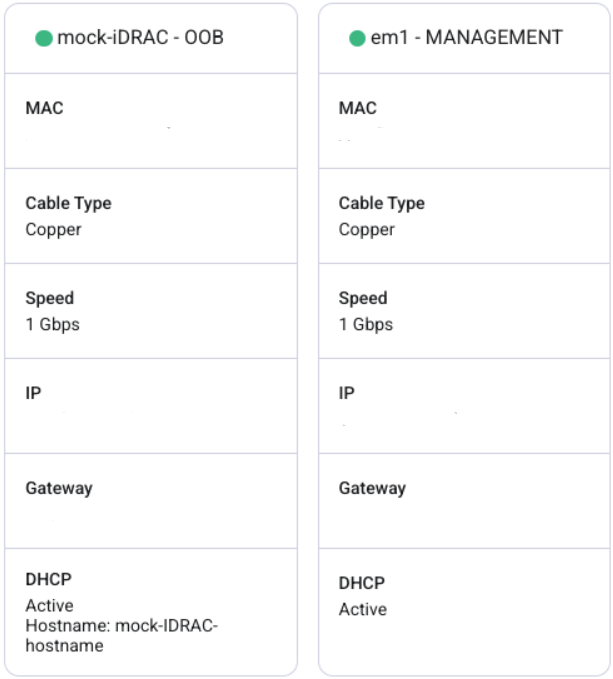
- In the iDRAC and management panes, verify that the green indicator appears in the header, and check the network info.
Note
The other dashboard panes do not display any data until the SPAN ports are connected to your network switch. The other panes are populated only when this connection is established.
Connecting the SPAN Ports
To start collecting asset data from your network, connect your network switches to the SPAN ports of the Axonius Network Collector device. For more information about the SPAN ports, see the Network Inspector Specifications.
Monitoring the Network Connectivity
After you connect the Axonius Network Inspector to your network switches, you can use the dashboard to monitor network connectivity.
On a periodic basis, perform the following checks:
- Check the SPAN port panes to verify that each of your SPAN port connections is OK and that the connection speeds are appropriate.

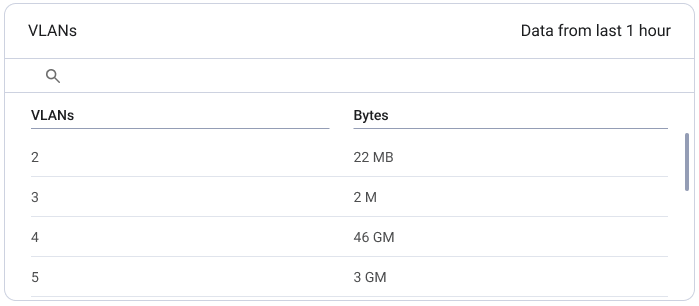
- Check the VLANs pane to ensure that the Axonius Network Inspector is monitoring traffic across all VLANs on your network. The following information is displayed:
- On the left column, VLAN ID is displayed.
- On the right column, the number of monitored bytes is displayed. A low value could indicate that traffic monitored from this VLAN is incomplete or incidental.
- The monitored period, up to 1 hour, is indicated at the top right of the pane.
- Information on this pane relies on SPAN traffic that contains VLAN tags (Dot1q).
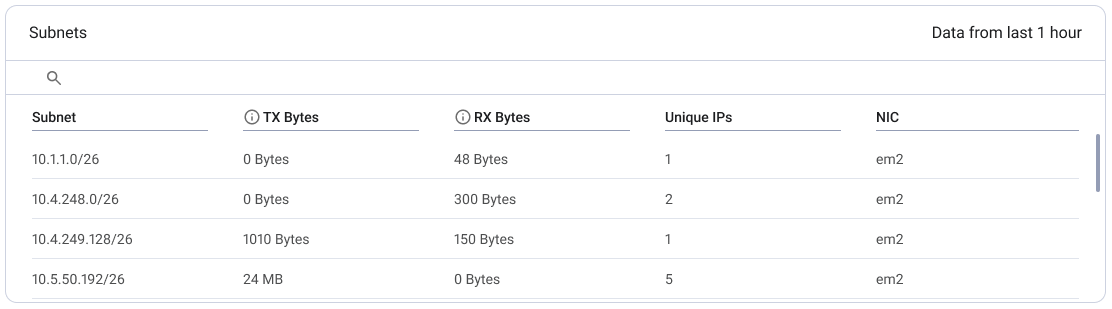
- Check the Subnets pane to make sure that the Axonius Network Inspector is monitoring traffic from all of the subnets on your network, and that the SPAN session includes bidirectional traffic. The following information is displayed:
- On the left column is the IP address range monitored, grouped into /26 ranges.
- Information columns, including:
- TX Bytes - Number of bytes transmitted from addresses in the IP address range. A low value may indicate that outgoing traffic monitored from this range is one-directional or incidental.
- RX Bytes - Number of bytes received by addresses in the IP address range. A low value may indicate that incoming traffic monitored in this range is one-directional or incidental.
- Unique IPs - Number of unique IP addresses within the IP address range that have been observed.
- NIC - The interface on which this traffic was seen.
- The monitored period, up to 1 hour, is indicated in the top-right corner of the pane.
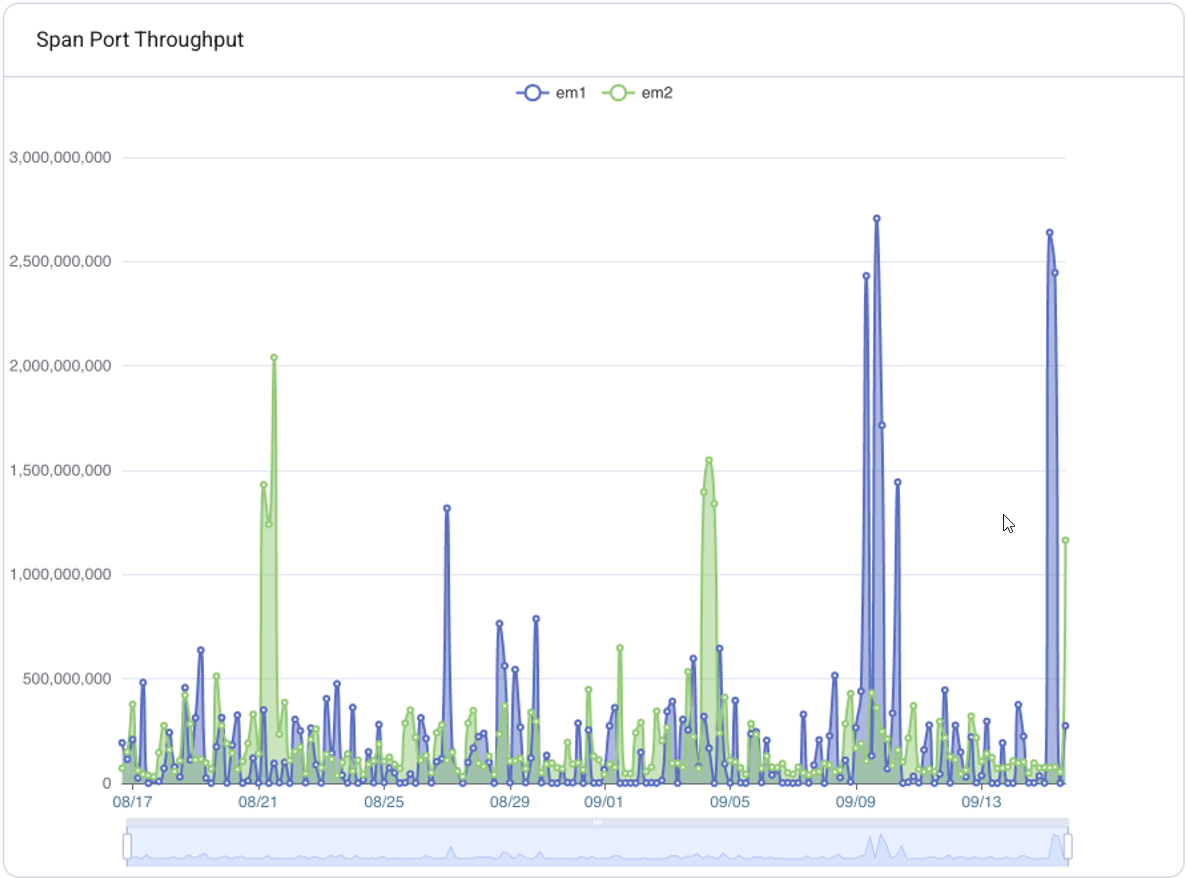
- Check the SPAN Port Throughput graph to view the volume of traffic into the Axonius Network Inspector from each of the SPAN ports over time.
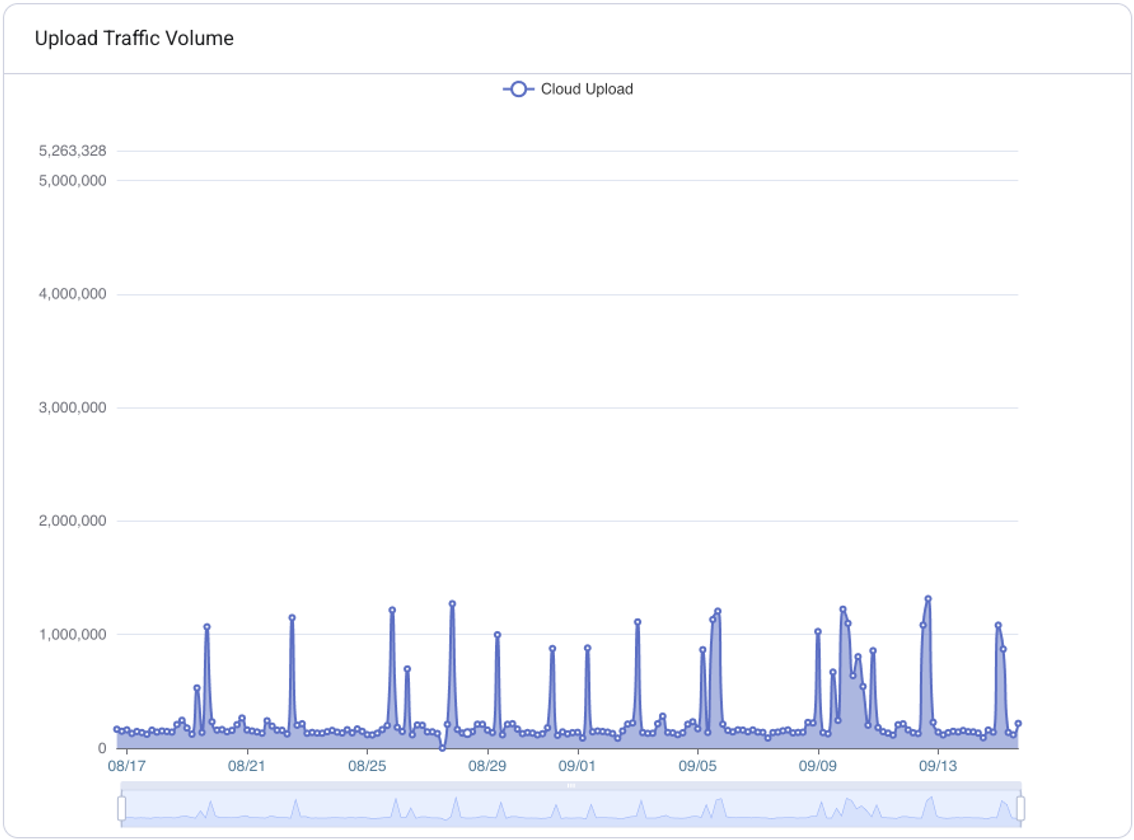
- Check the Upload Traffic Volume graph to view the total volume of traffic sent from the Axonius Network Inspector to the cloud over time.
Updated 2 months ago