
Analyzing Query Data - Creating Data Analytics Reports
The Data Analytics page enables you to load query data into a configurable pivot table within Axonius. Use this feature to customize the way the data is aggregated and calculated, and then save the resulting report for further analysis, or share it with others within an Axonius report. See Report Configuration Page for more about including pivot table data in an Axonius report.
Verify that your system meets the minimum suggested requirements.
The benefits of the Data Analytics page include the following:
-
Simplified Data Analysis - The pivot table enables you to quickly and easily view query results in a simple, organized table. This makes it easier to analyze and understand the data.
-
Customizable Aggregations - Customize the aggregation of query data by choosing which columns to use as rows, columns, and data fields. You can also specify the calculation types, such as sums, averages, or counts with calculated fields.
-
Quick and Easy Filtering - You can filter the pivot value to make it easier to isolate subsets of data based on specific criteria. This can help you focus on the data that is most relevant to you.
-
Interactive - Rearrange, filter, and update the data to quickly explore different scenarios and uncover insights that might be hidden within the data.
-
Descriptive Statistics - Use calculated fields to calculate descriptive statistics, such as sums, averages, and standard deviations to gain a deeper understanding of the data and identify patterns and trends.
The Data Analytics pivot table is a powerful tool that helps you to make more informed asset management and cyber risk decisions.
To access the Data Analytics page, on the left navigation panel, click  .
.
In Axonius New Navigation Experience, access Data Analytics from the Analysis menu.
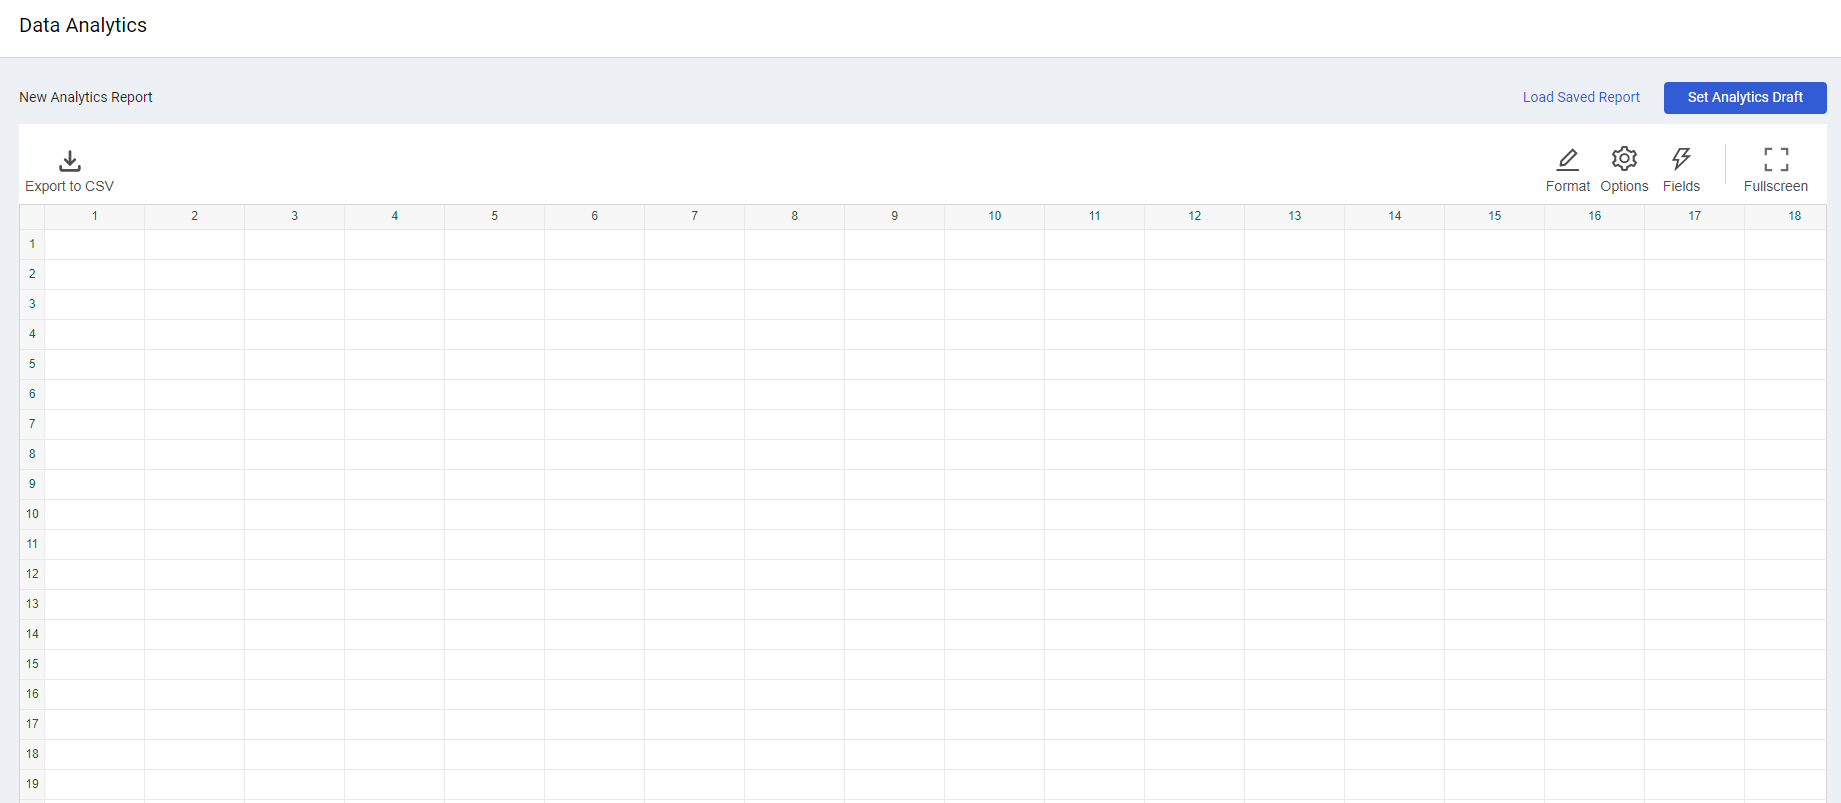
When the Data Analysis page is displayed, no data appears. Load query data to start working with the pivot table.
Permissions for Data Analytics
To use Data Analytics tables and to add them to Reports, your assigned role must have the following permissions:
-
To load a query - Permission to view that asset type. For example, to create a table with SaaS application repository asset data, you need the View saas applications repository permission under the SaaS Applications Repository assets permission group.
-
To save a Data Analytics report - The Save data analytics permission in the Global Actions permission group.
-
To load an existing Data Analytics report - Permission to view that asset type.
-
To add a Data Analytics report to a system report - The Add report permission under the Reports permission group as well as permission to view that asset type.
-
To export a Data Analytics table to CSV - The Export to CSV permission under the Dashboard permission group.
Loading Query Data Into the Table
Load query data into the table by creating a new report or loading a saved report. Once it is loaded, you can begin working with it. The number of rows displayed automatically fits the size of the screen.
Creating a New Report
You create a new report in the following order:
- Select the contents of the report, including the module, query, fields, and how to split data in the table.
- Load the report.
This enables you to choose only the necessary fields instead of loading them all.
To create a new report
-
Click Set Analytics Draft.
-
In the Set Analytics Draft dialog that opens, from the Module dropdown, select an asset type, and then from the Select Query dropdown, select a query. The query includes any data refinements set for that query. Note that you cannot select private queries. The query is run, and the results are stored in cache. The Select Fields box is filled with all fields in the assets returned from the selected query.
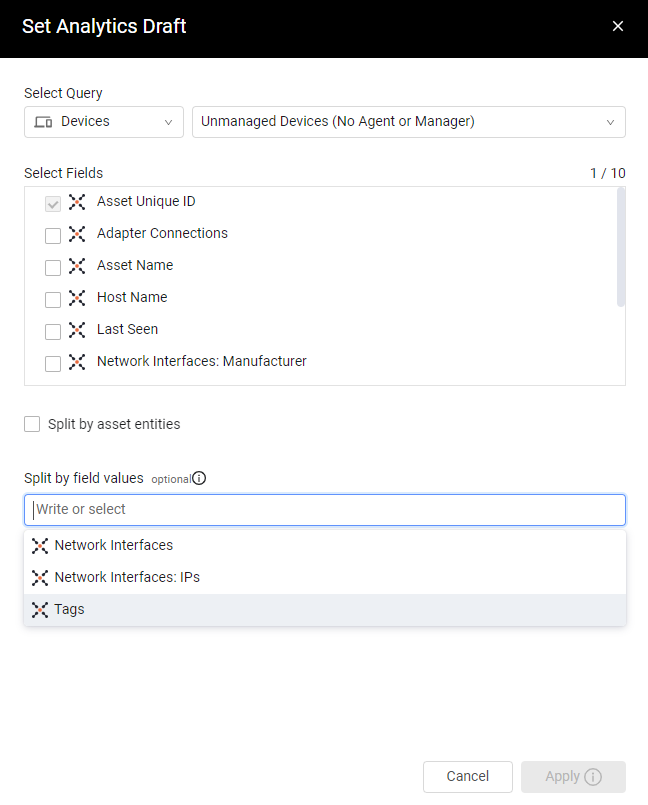
- Select the checkboxes of fields to load into the table. You need to select at least one field besides for Asset Unique ID (selected by default as it is required in all reports). Less fields selected decreases load time.
- Optionally,split data by asset entities or field values.
- Click Apply. The selected fields from the query results are loaded into the grid. The query data is aggregated by adapter.
- Make changes to the Data Analytics report view, if required.
- Save the report.
Loading a Saved Report
To open a saved report
- Click Load Saved Report.
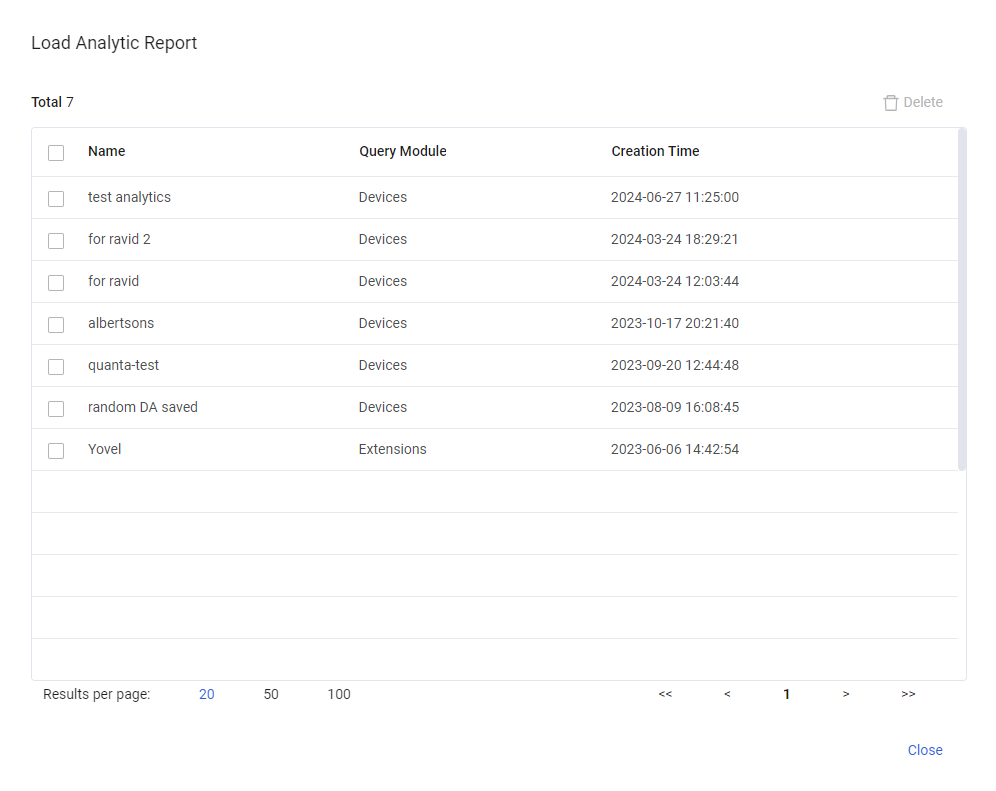
- In the Load Analytics Report dialog, click the report to load. The data is loaded into the table and presented exactly as it was saved, including column selection and filters.
- If the saved report does not have data, click Cancel to close the report.
- Make changes to the saved Data Analytics report view, if required.
- Save the report.
Expanding Table Rows
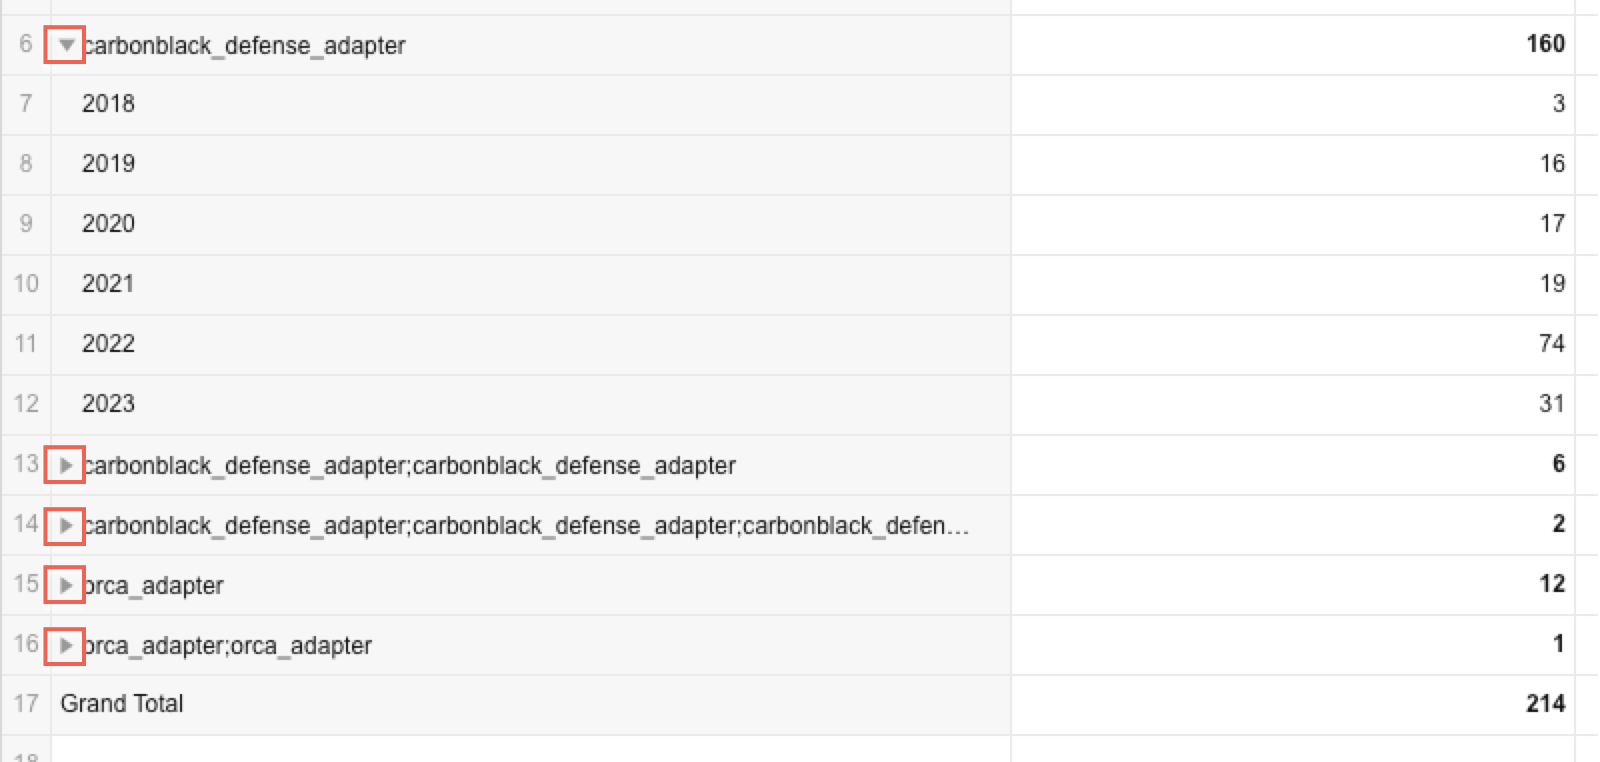
Depending on the field configuration, table rows may be expandable.
To expand or collapse all rows at the same time:
- Expand all rows - Click Expand All
- Collapse all rows - Click Collapse All
Navigating Long Reports
-
Click Scroll to Bottom to view the last rows of the report. Total rows are usually at the bottom of the report.

-
Click Scroll to Top to return to the top of the report.
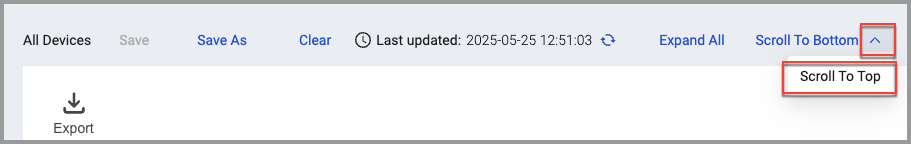
Refreshing the Report
The date and time data was last updated is displayed above the toolbar near Last Updated.
To view the most recent query results
- Click
 . The selected query reruns and displays the most recent data. Field, formatting, and filtering selections remain unchanged.
Clearing the Table
To remove all data from the table
- Click Clear. All data is cleared from the table.
Deleting Analytics Reports
To delete saved Analytic reports
In the Load Analytics Report dialog, click the checkboxes of the reports to delete, and then click Delete.
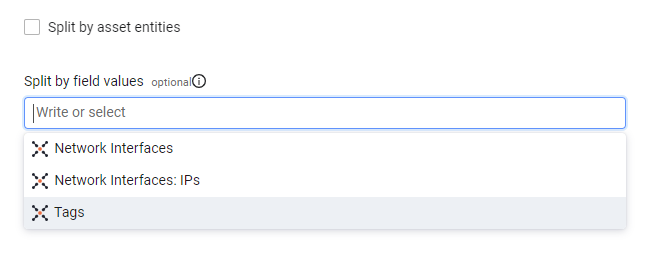
Splitting Data by Asset Entities or Field Values
You can decide whether to split the data in the table and if yes, how to do so.
To split the data
- To split the data by asset entities, select the Split by asset entities checkbox.
- To split by field values, click in the empty field list below Split by field values and select the adapter fields that you want to split into single-value rows. You can select as many as needed. This will split each multi-value row into one row for each value. The limit is 500K rows.
Modifying the Analytics View
You can modify the view of a Data Analytics report draft or of a saved report. To modify the Data Analytics report view
- Click Modify Analytics View. The Modify Analytics View dialog opens, showing the existing configuration.
- If required, select a different asset type from the Module dropdown and/or a different query from the Select Query dropdown.
- Clear/select checkboxes of fields, so that only checkboxes of fields to be loaded into the table are marked. You need to select at least one field besides for Asset Unique ID (selected by default as it is required in all reports). Less selected fields decreases load time.
- Change the splitting of data, as required.
- Under Table View, select whether to ignore blank fields. When not ignored, a blank field may have "blank" as a value. When ignored, no value appears in the field.
- Under Theme color, select a color scheme to apply to the report.
- Click Apply. The selected fields from the query results are loaded into the table.
Saving Query Data
You can save the table with the data and your configurations.
To save a query data report
- Do one of the following:
- To save a new report, click Save As, and in the Save As dialog, give the report a meaningful name, and then click Save. The data is saved as a CSV file.
- To save changes to an existing report, click Save. Changes are saved immediately.
Note
- Saved reports are automatically updated every three hours. The query is run and the results are saved.
- When a saved query is used to create a data analytics report, the data analytics icon appears in the Used In field in the Query table.
Configuring Pivot Table Fields
In the Fields dialog, you can define the row and column fields in the pivot table.
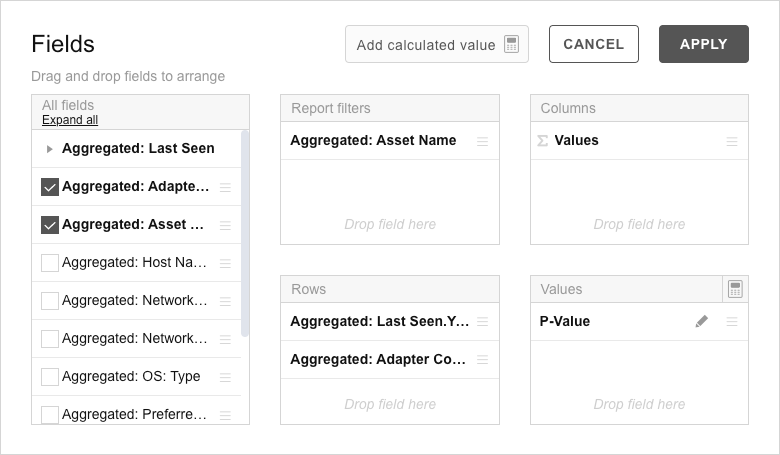
On the left is a list of all available fields from the saved query. If there are more than 50 fields, a search bar appears at the top of the list of fields.
Note
Only fields specified in the saved query are included in the pivot table. If a field you want does not appear in the list, you must include it in the saved query and run the query again.
Values are typically placed in columns but can also be dragged to rows. Each value has an aggregation function applied to it. Depending on the data source type, numeric fields support different aggregation functions. String fields can also be selected for values.
By default, numeric and string fields are aggregated using the sum and count functions, respectively. To change the aggregation function, click the sigma icon and choose a new aggregation.
To configure the pivot table fields
-
Click Fields in the pivot table toolbar to open the Fields dialog. You can also click the diagonal arrow in the upper-right corner of the table. The Fields dialog can be resized.
-
Drag and drop fields to the Report filters, Rows, Columns, or Values lists.
Fields can also be dragged between the lists or inside them to arrange the order. Each list can have as many fields as you want. You can also include any level of a hierarchy, as well as all its sub-levels, in rows or columns.
-
To remove a value or field from one of the lists, drag it back to the Fields list on the left.
-
Click APPLY.

You can also add a calculated value to the table. See Adding a Calculated Value.
Adding a Calculated Value
Use calculated fields to add custom calculations to the table.
To add a calculated value
- Open the Field List and click Add calculated value.
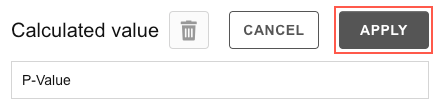
- In the empty text box, enter a value name.
- Next to the fields you want to use, click the sigma icon to select the type of value to use.
- Drag fields from the list of fields to the formula box. Click an arithmetic operator to add it. You can also manually enter field names, operators and values with the keyboard.
- Select Calculate individual values to calculate the formula using raw values.
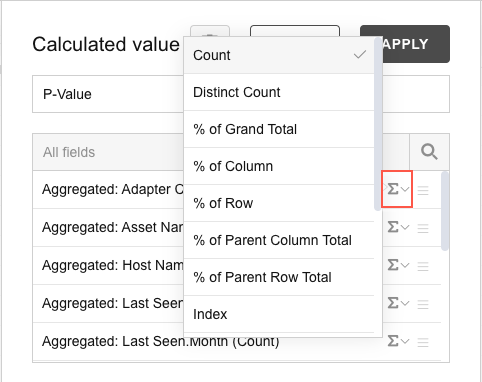
- When you are finished configuring the calculated value, click APPLY. The new value is added to the Values list in the Fields dialog.
- In the Fields dialog, click APPLY.
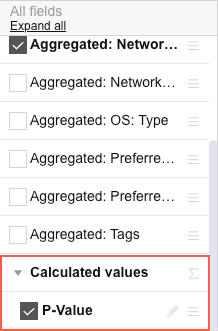
All calculated values are grouped under the Calculated values folder in the All fields list.
To edit a calculated value
- Click the pencil icon next to the value name either in the Fields list or in the Values list. Make the changes you want and click APPLY.
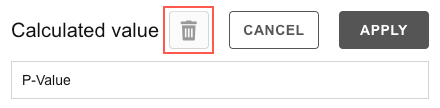
To remove a calculated value
- Click the trash can icon at the top of the Calculated value dialog.
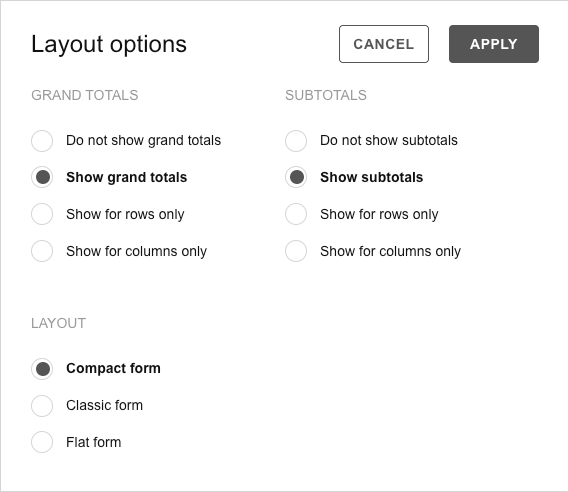
Setting Layout Options
You can change the layout of the pivot table to make it easier to read.
To change the layout of the pivot table
- From the toolbar, click Options.
- Select the options you want and click APPLY.
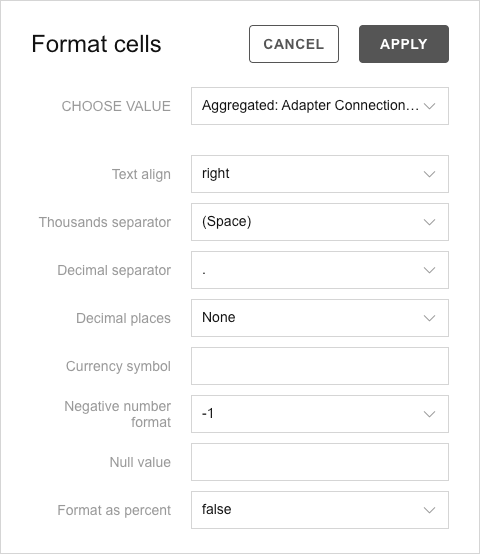
Formatting Cells
You can format cells to make it easier to locate the values you want.
To format cells
- Select the cells you want to format.
- Hover over the Format icon in the toolbar and click Format cells.
- From the CHOOSE VALUE list, select the value whose cell you want to format.
- Select the options you want and then click APPLY.
Applying a Color Scheme
You can apply a color scheme to the table to make it easier to read.
To apply a color scheme:
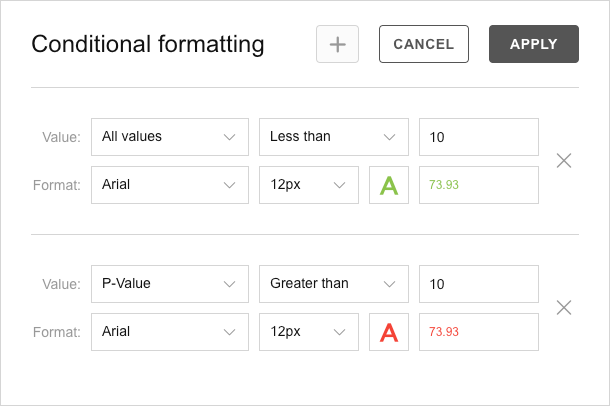
Using Conditional Formatting
Conditional formatting can be used to identify extreme values or to highlight a particular value in the table.
To apply conditional formatting
- Select the cells you want to format.
- Hover over the Format icon in the toolbar and click Conditional formatting.
- To add the first condition, click the
+at the top or + Add condition. - To add more conditions, click the
+at the top. You can add as many conditions as you want. - To delete a condition, click the X to the right of the condition.
Filtering Fields
Apply a filter to a field to refine the data displayed in the table. The types of filters available depend on the field.
The following types of filters are available:
- Category filters - Filter by subcategory.
- Value filters - Filter based on value.
- Conditional filters - Filter based on a condition.
Applying Category Filters
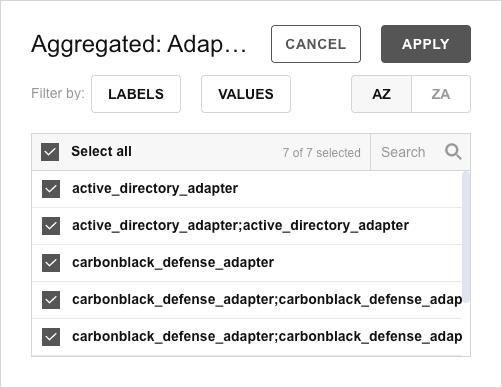
Fields that have subcategories can be filtered by including or excluding the categories.
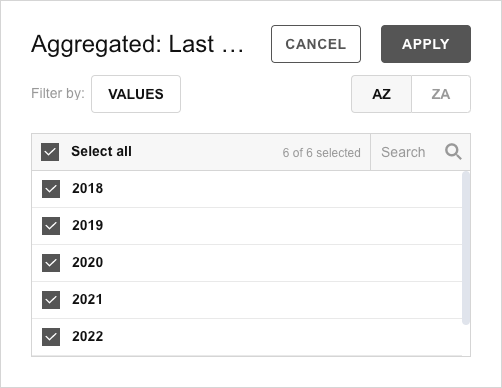
To apply a category filter
- To the right of a field, click the gear icon.

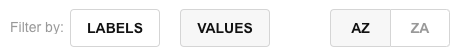
- Select the categories you want in the table. Click AZ or ZA to sort the list.
- Click APPLY.
Applying Value Filters
You can filter the data by field value.
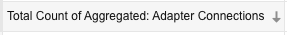
For example, Count of Aggregate Connections is the field to filter, Top is the condition, and 10 is the condition value.
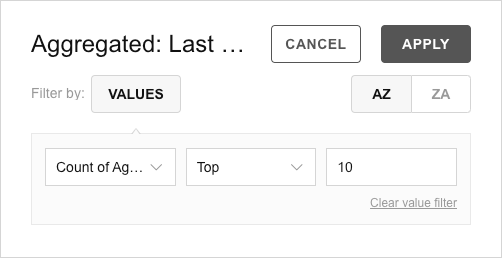
See Conditional and Value Filter Operators for a list of operators available for each field type.
To apply a value filter
-
To the right of a field, click the gear icon.
-
In Filter by, click VALUES.
-
From left to right, select the field, the condition and the value.
-
Click APPLY.
Applying Conditional Filters
You can filter field members based on a condition. For example, you can create a filter to display dates of the previous quarter or assets whose name contains a specific text string.
You can apply a conditional filter to the following field types:
- Number
- String
- Date
- Time
See Conditional and Value Filter Operators for a list of operators available for each field type.
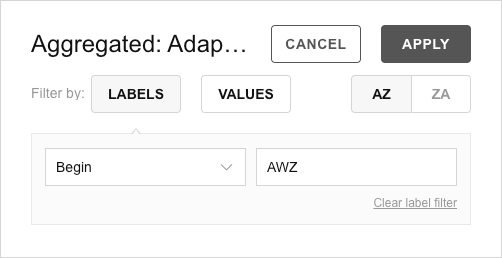
To apply a conditional filter
- To the right of a field, click the gear icon.
- In Filter by, click the type of field to which the conditional filter applies.
- Labels – for string and number fields.
- Dates – for date fields.
- Time – for time fields.

-
Select the condition and enter the values required by that condition. Some conditions require more than one value.
-
Click APPLY.
Sorting the Pivot Table
You can sort the pivot table to reorder the data.
To sort the table
- Hover over a column header and click the up or down arrow.
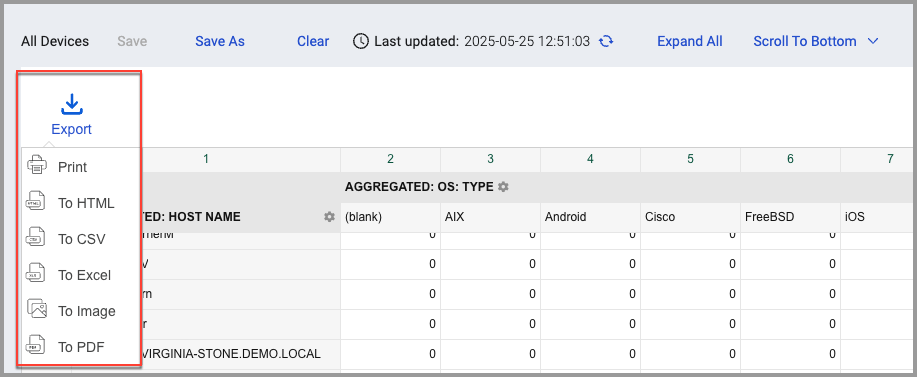
Exporting Query Data
Export data analytics reports to the following formats: Print, HTML, CSV, Excel, Image, and PDF.
To export a data analytics report:
- Use the data analytics functions to create the report you want.
- From the toolbar, click Export and select a format from the list. The data is immediately downloaded to your local Downloads folder.
System Requirements for Data Analytics
The following requirements must be met to use the Data Analytics page:
- A web browser. It is recommended that you use the most up-to-date version available for the best experience. The minimum browser requirements are listed below:
- Chrome 12+
- Firefox 15+
- Microsoft Edge
- Opera 15+
- Safari 6.1+
- iOS Safari 5.1.1+
- JavaScript must be enabled.
- The minimal recommended size for the pivot table component is 400×300px.
- Internet Explorer 11 up to version 2.9.38
Updated 5 days ago