Asset Graph
Use the Asset Graph page to view a visual representation of the connections between the assets in your inventory. You can start by viewing the details of a single asset, such as a device, and then use the capabilities of the graph to ask questions about the device and both expand and filter what is displayed. You can also start with multiple assets from one of the asset tables or select an asset type directly in the Asset Graph page.
The Asset Graph provides many benefits, including:
- A graph gives a visual representation of the relationships between assets that allows you to quickly understand the topology.
- Multi-step analysis and deep dive into the relationship between assets.
- You can see the downstream impact of incidents.
- Investigation is faster, straightforward and more accurate.
- Quickly understand the relationship between assets.
- Ability to triage asset issues quickly.
- Easier to explain the attack surface to non-technical teammates.
- Allows to easily determine the blast radius of an incident.
To display the Asset Graph, click ![]() in the left navigation bar.
in the left navigation bar.

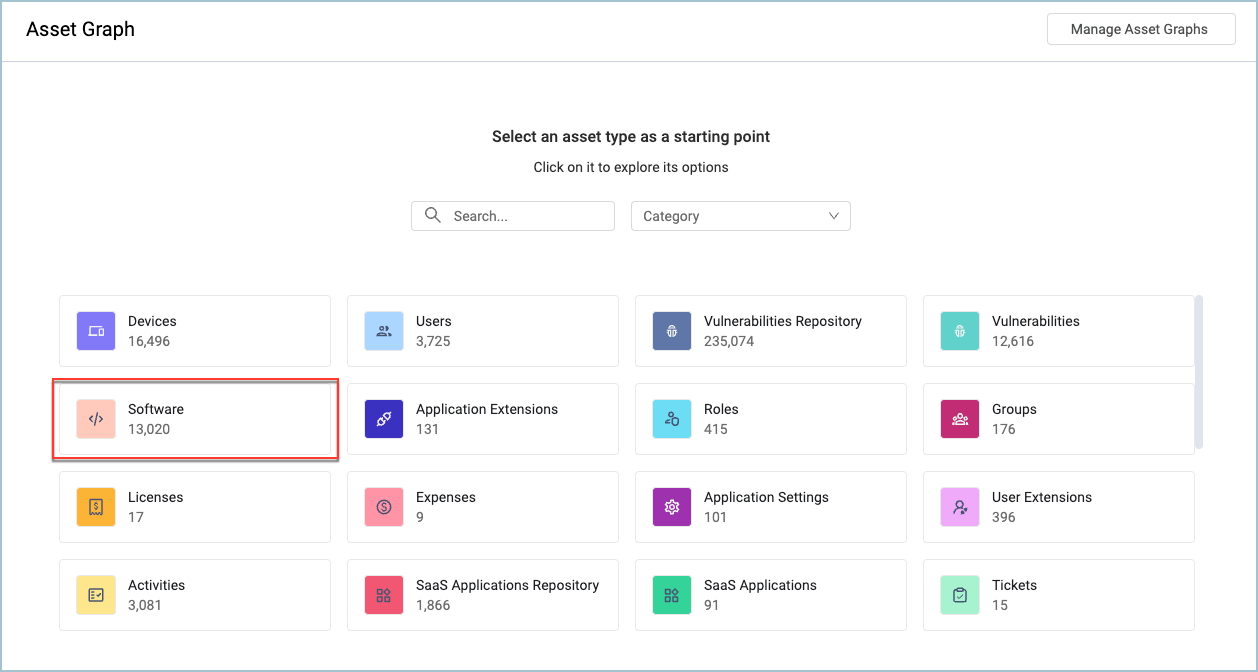
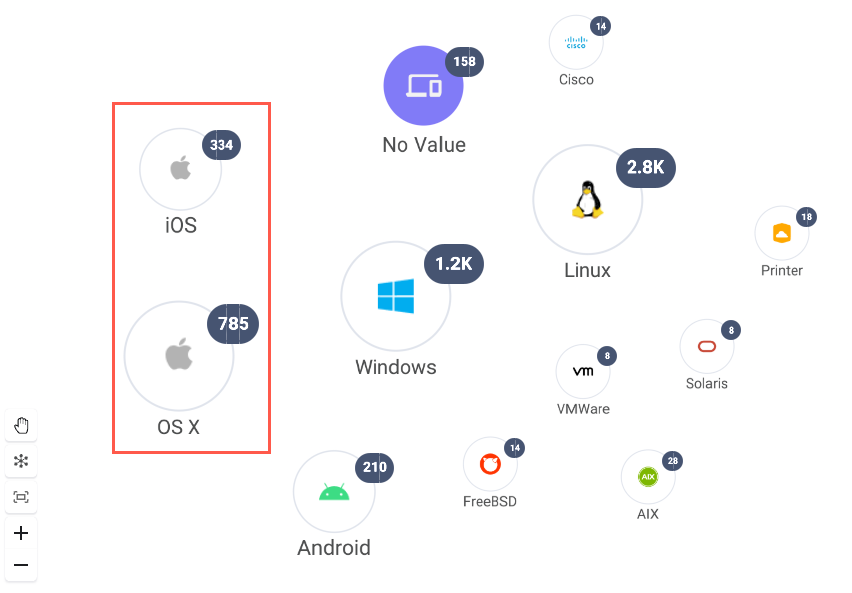
A tile for each asset type in the environment is displayed. The number of assets of each type is displayed in the tile below the asset type name. See Accessing the Asset Graph for more details about how to access the Asset Graph from the Asset Profile page or one of the asset pages such as Users or SaaS Software.
Accessing the Asset Graph
There are three ways to access the Asset Graph:
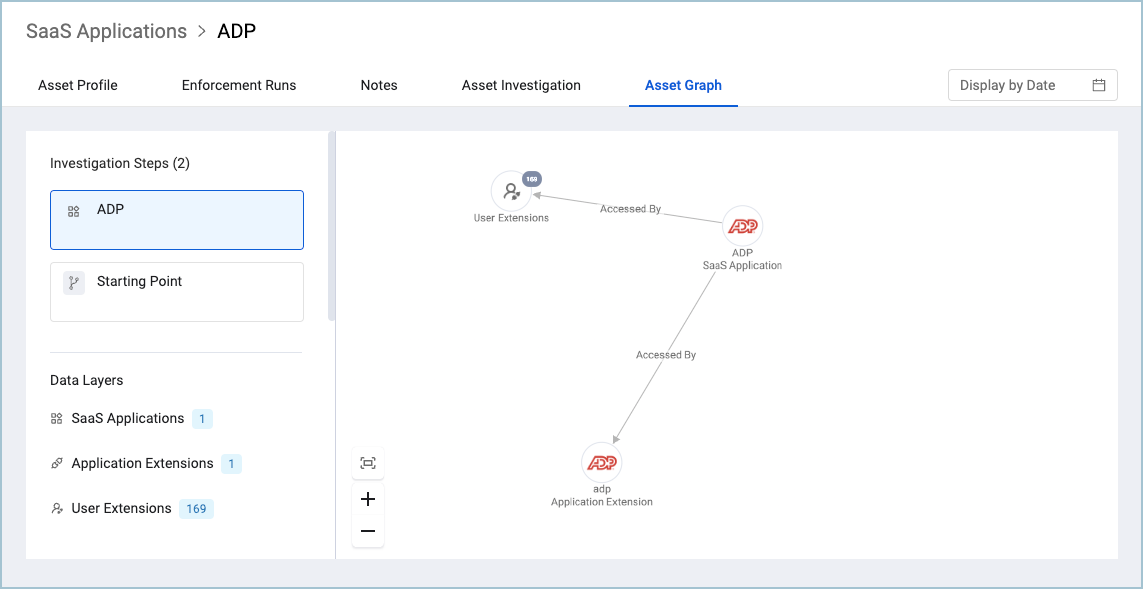
A single asset from the Asset Profile page
- From an Asset page, select a single asset to view the Asset Profile page. and then, from the Actions menu, select Open in graph.
You can also select the asset to view its details and click the Asset Graph tab. This works exactly as does the Asset Graph page. The selected asset and all the other assets directly connected to it appear in the graph.
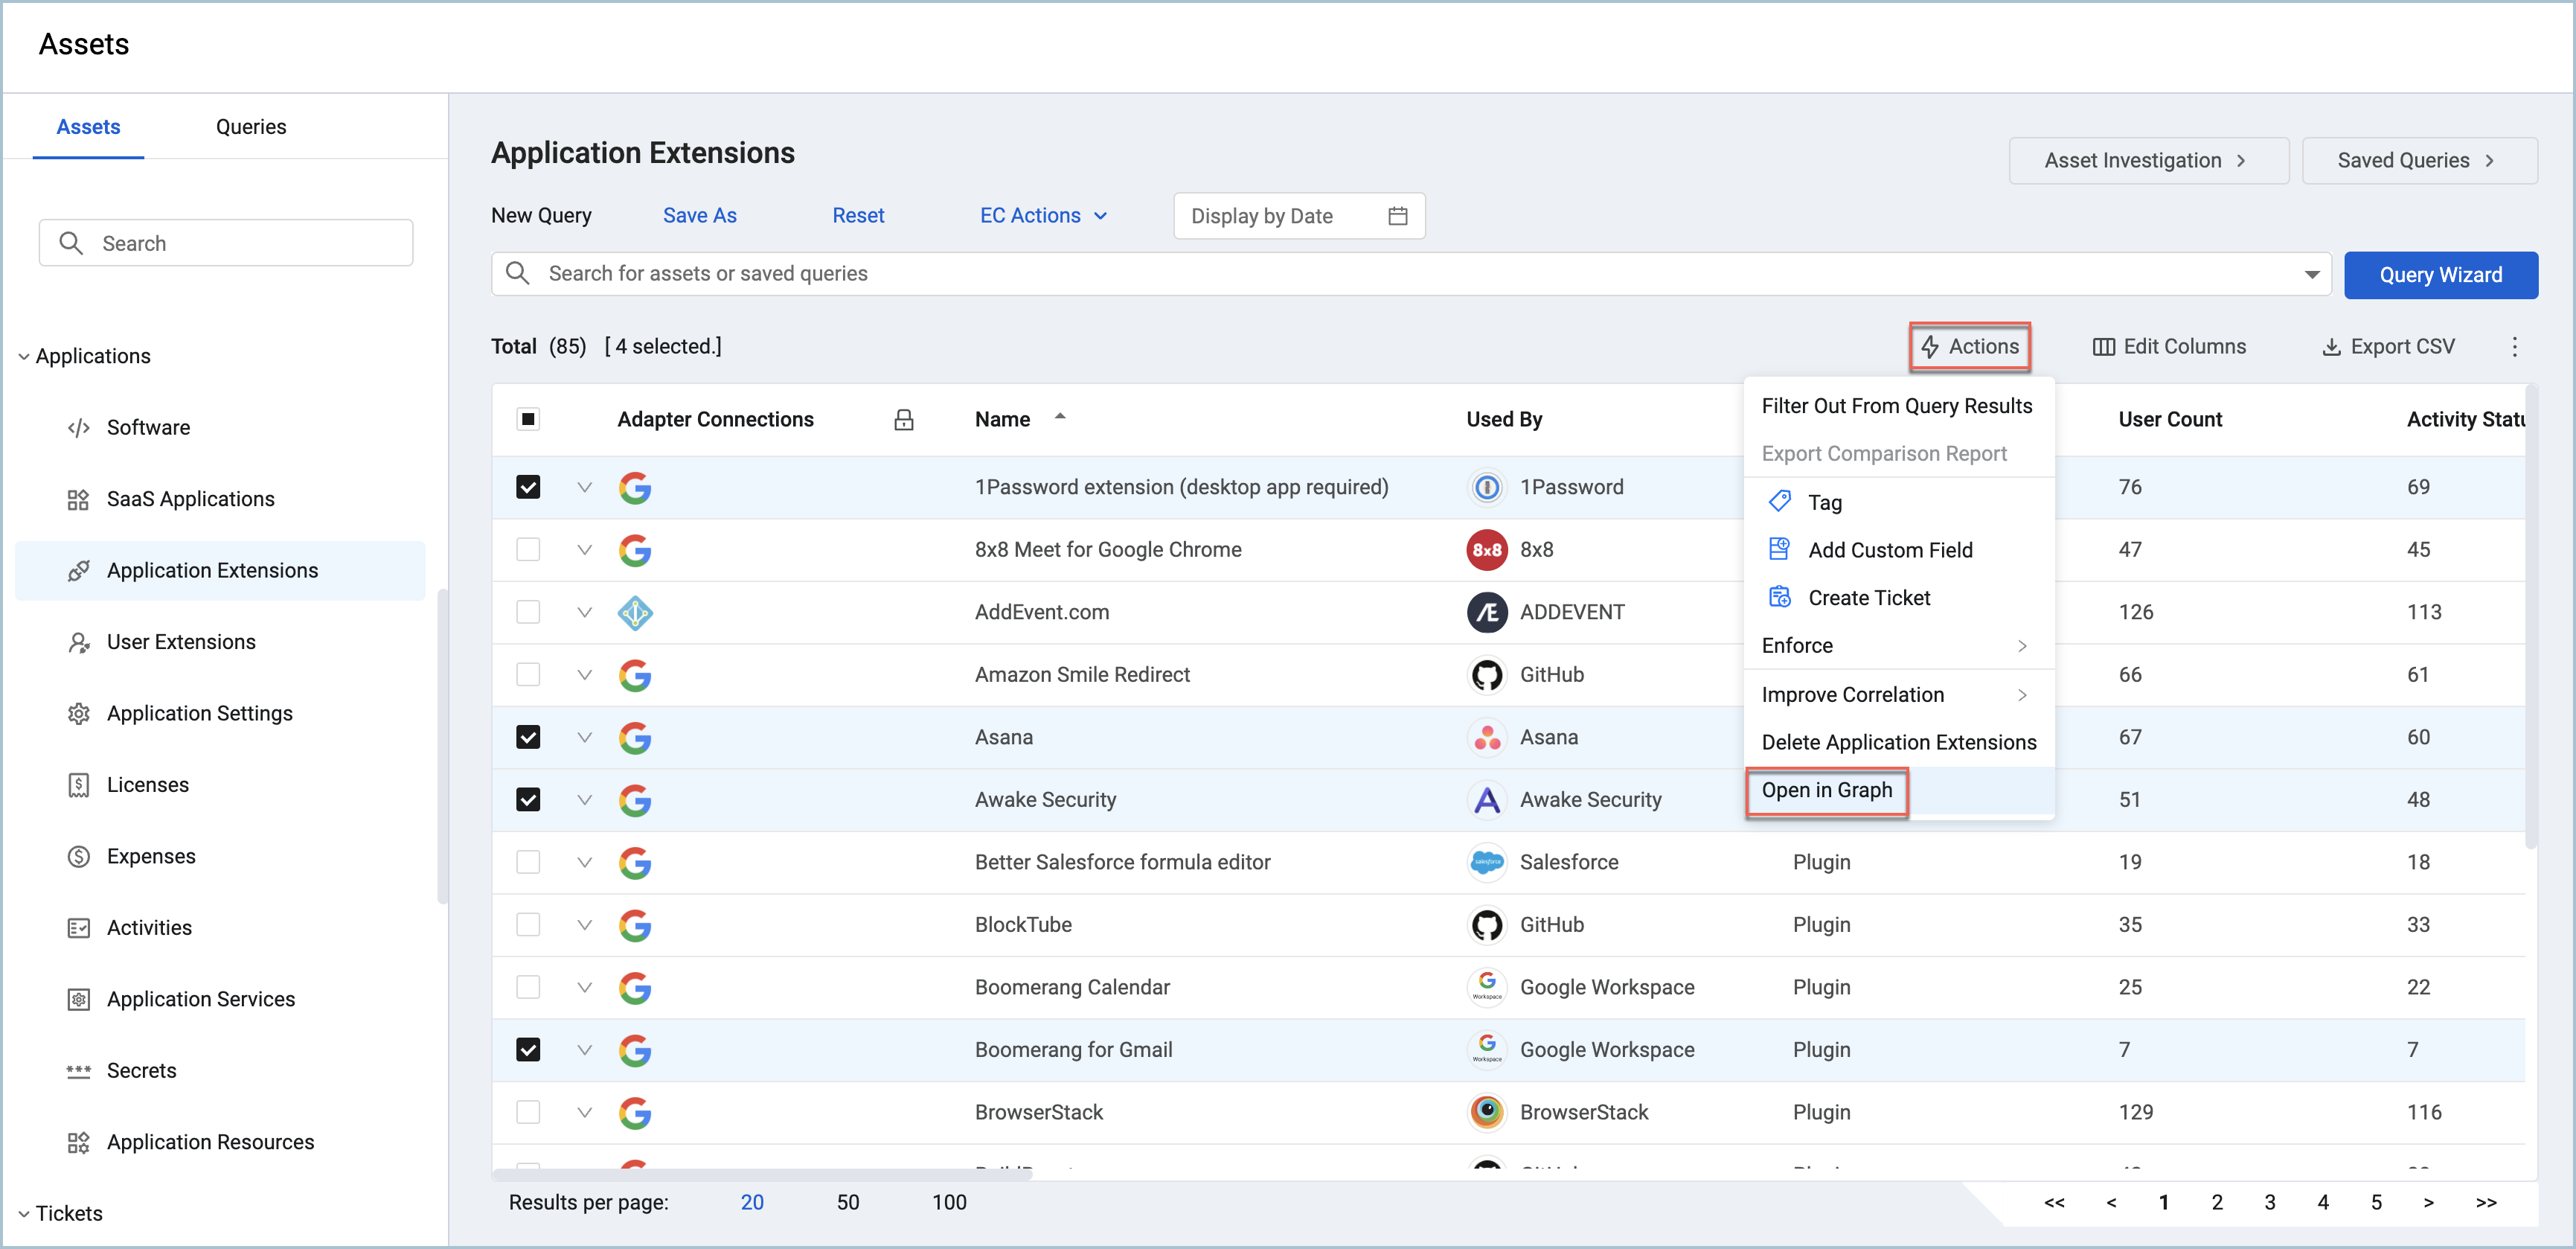
Multiple assets from an Asset page
- From any asset page, such as Devices or SaaS Applications, select multiple assets in the table and from the Actions menu, select Open in graph.
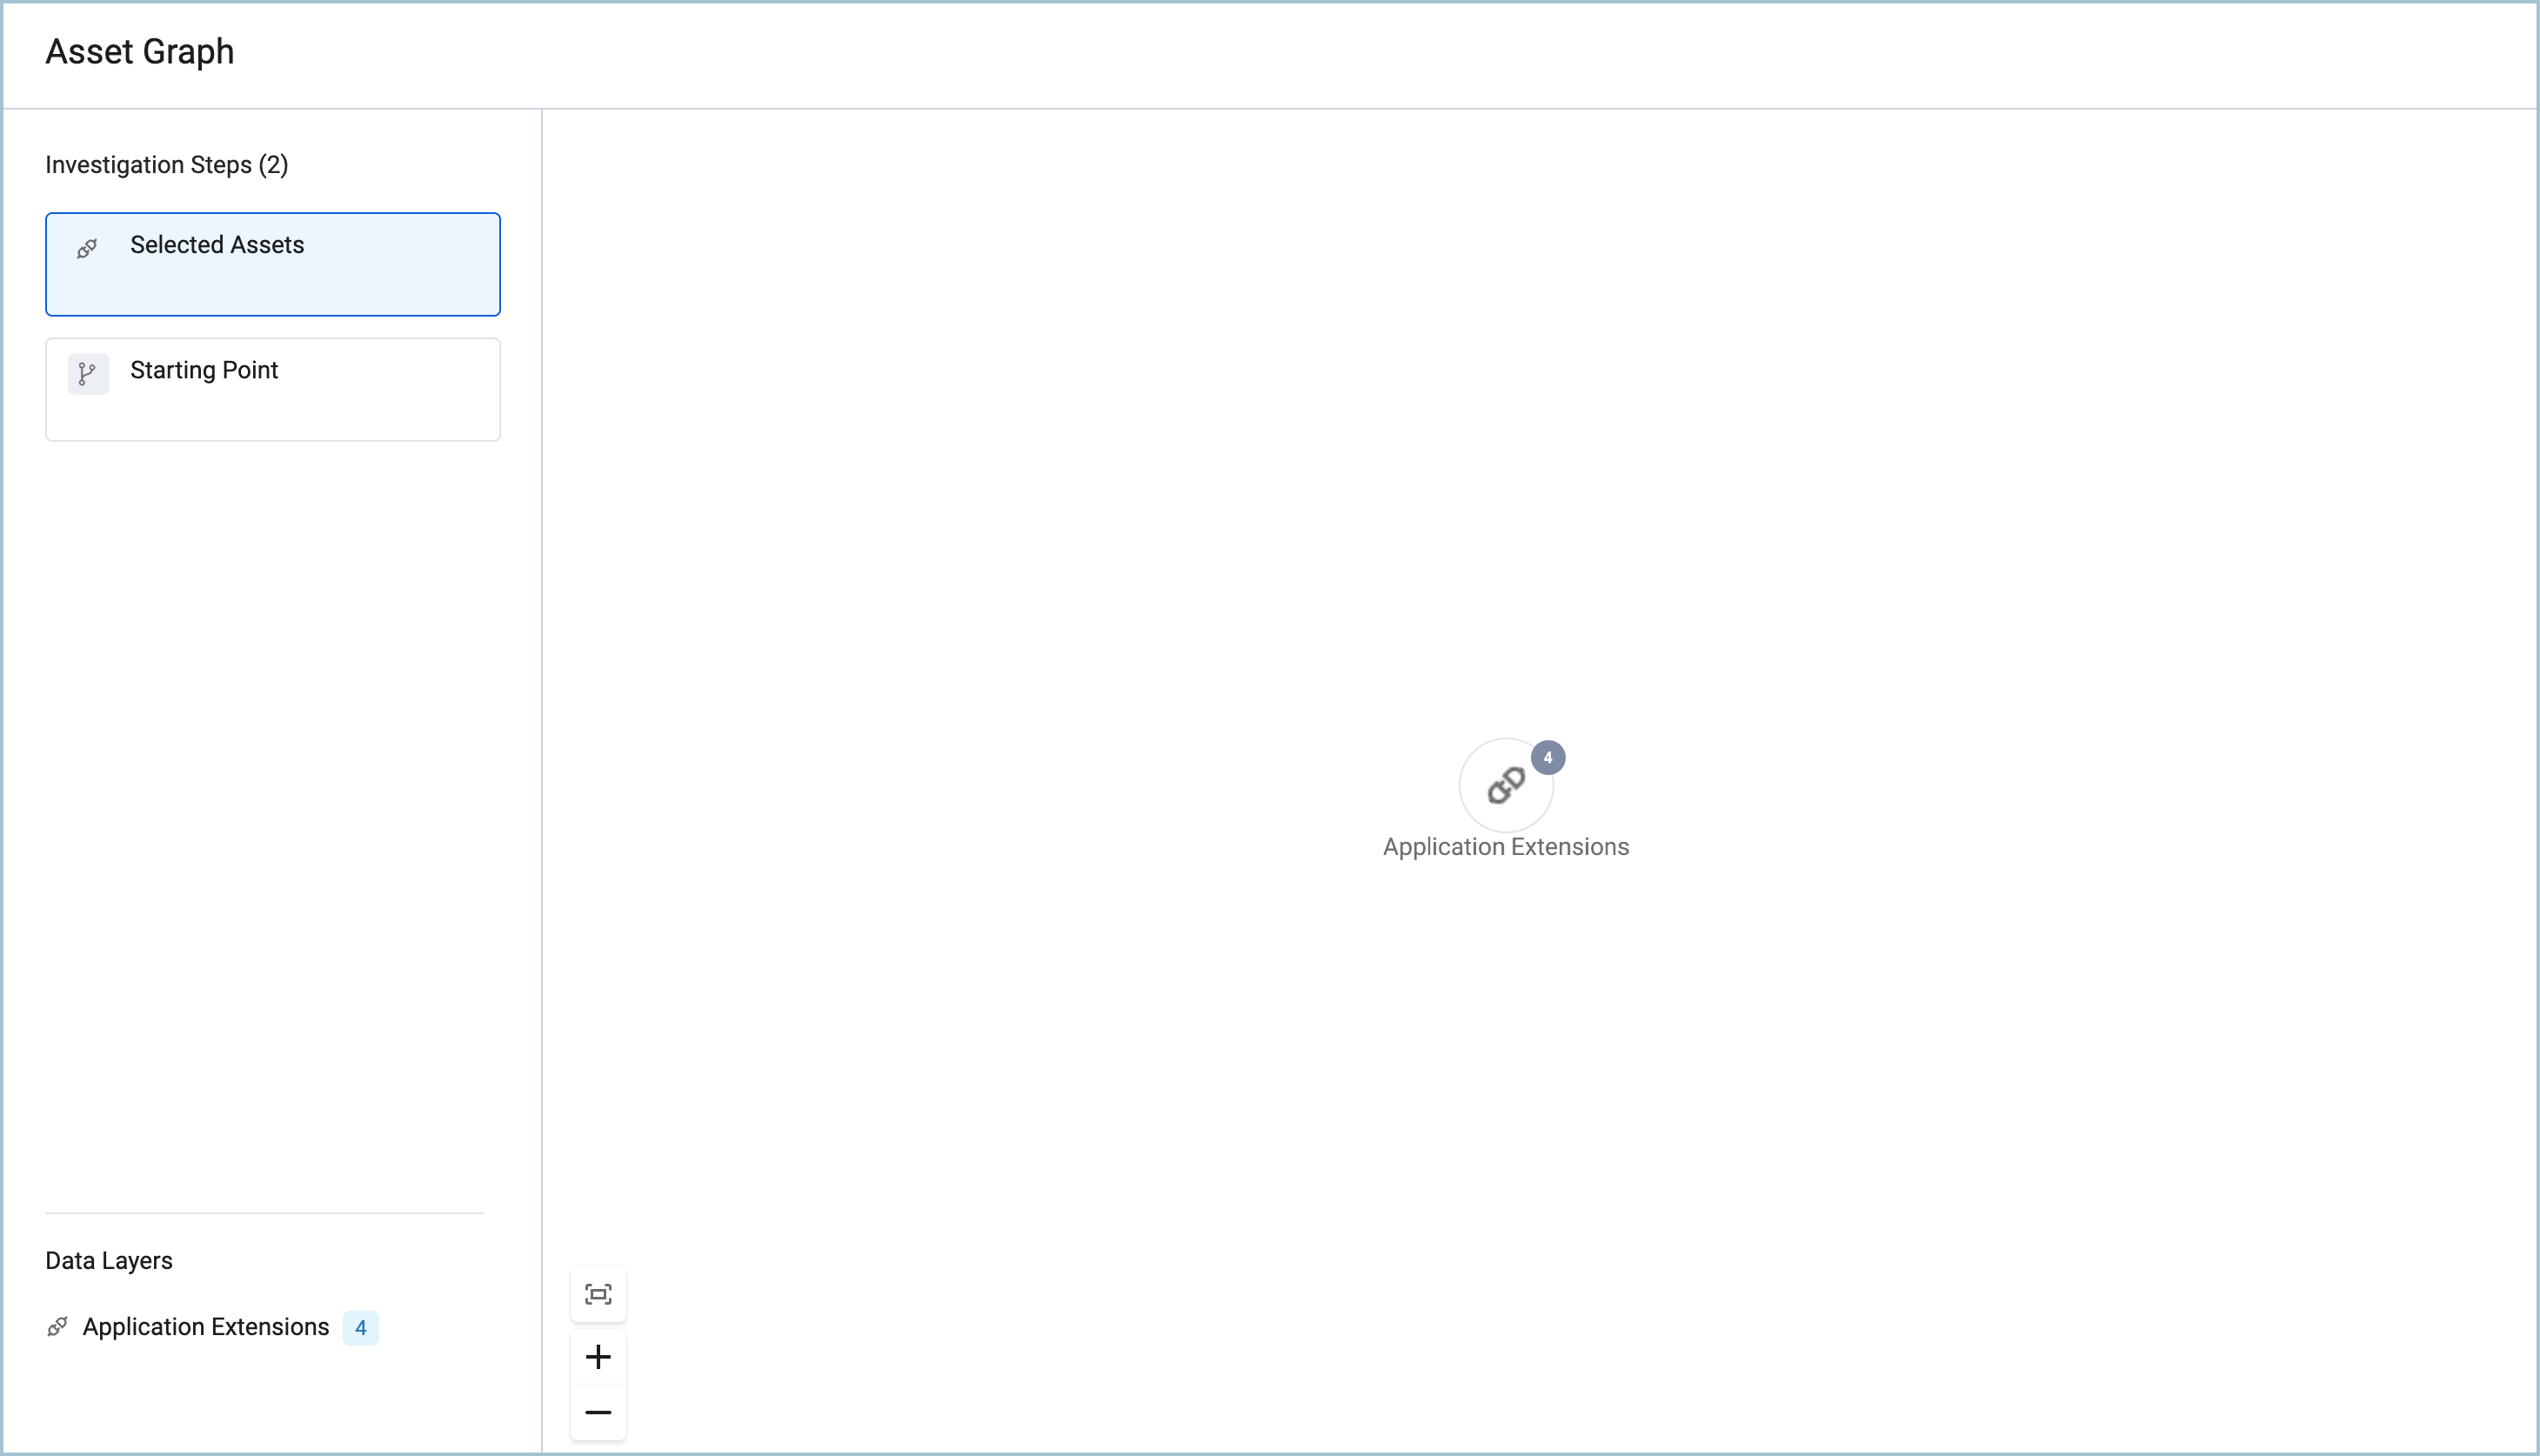
The graph opens in the Asset Graph page showing a group icon for the selected assets in the center of the graph area.
All assets in the Asset Graph page from the Navigation toolbar
- Click
 in the left navigation bar. A tile for each asset type in the environment is displayed. The number of assets of each type is displayed in the tile below the asset type name.

You can filter the asset types by category from the Category list. You can select multiple categories. To return to the main Asset Graph view, click Starting Point in the Investigation Steps list or ![]() in the Navigation bar.
in the Navigation bar.
Getting Started with the Asset Graph
Once you access the asset graph, a list of asset types is displayed. Each asset type available on your sustem has a tile with the number of assets of that type. This is called the Starting Point in the Investigation Steps list. Select the asset type you want to start with.
These assets are loaded and are represented by a single node on the graph. The bubble on the node indicates the number of assets the node represents.
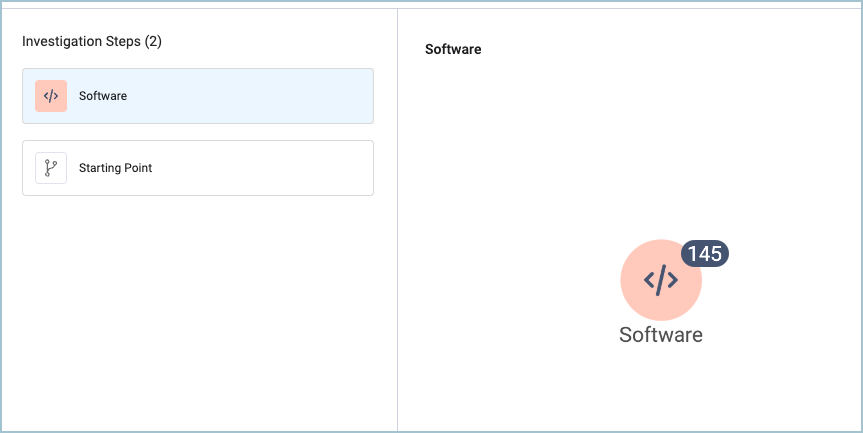
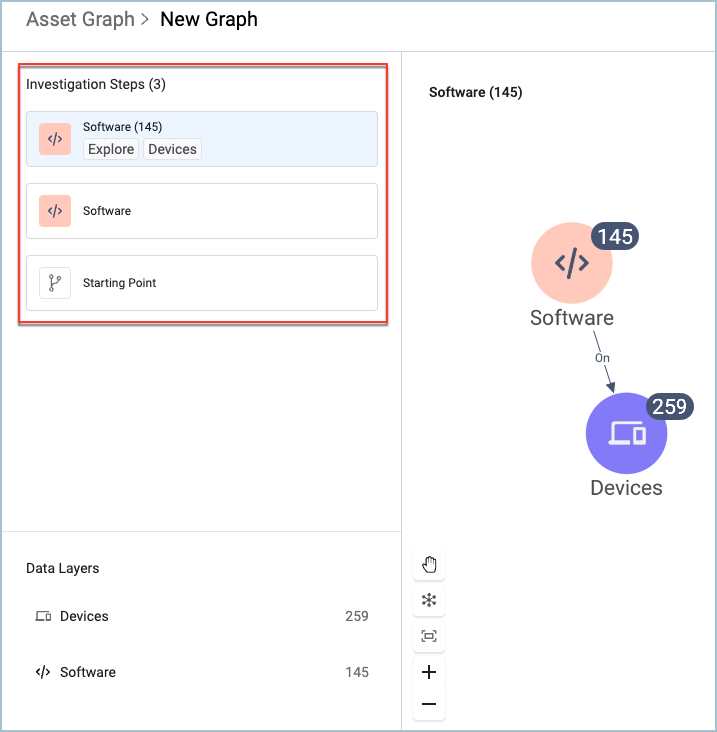
On the left, the Investigation Steps list shows the steps you have taken in your investigation. The first, the Starting Point, is where you selected the asset type to focus on. The asset type you selected is the second step in the Investigation Steps list. For each step, or action, you take in the graph, a new tile is added to the list.
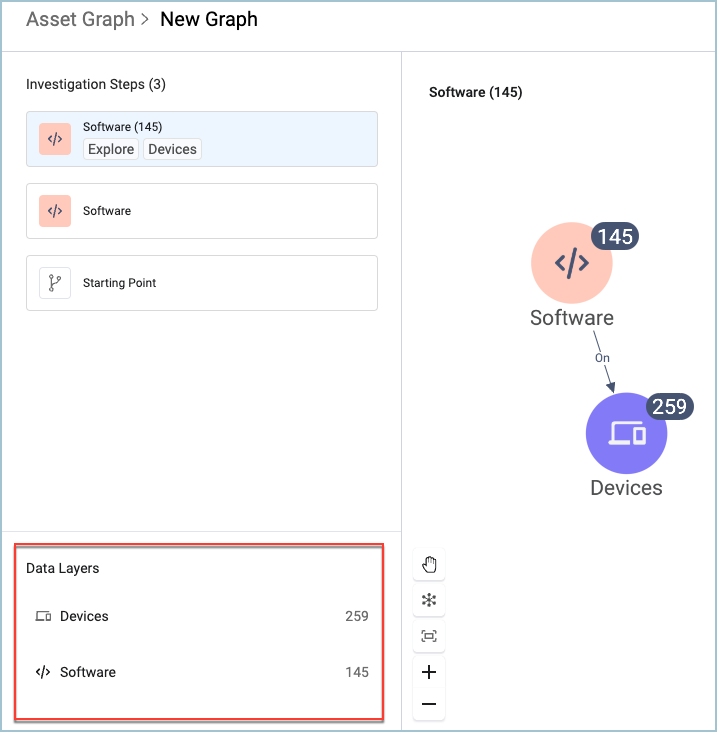
Below the Investigation Step list is the Data Layers list. Each asset type is a data layer and you can show or hide each layer separately.
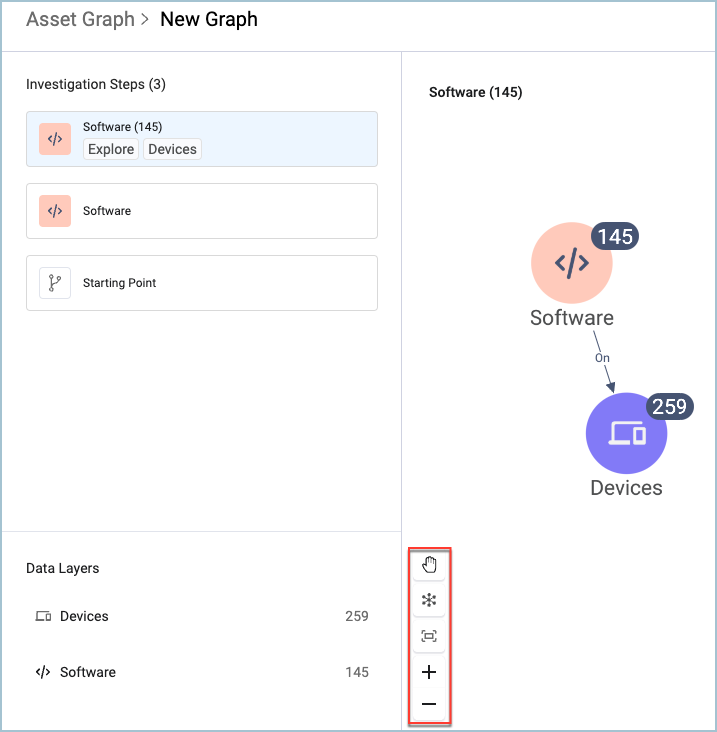
Use the graph tools to position the graph, select nodes and organize them.
As you continue the investigation, more nodes appear on the graph, sometimes connected by arrows. These arrows indicate a relationship between the assets.
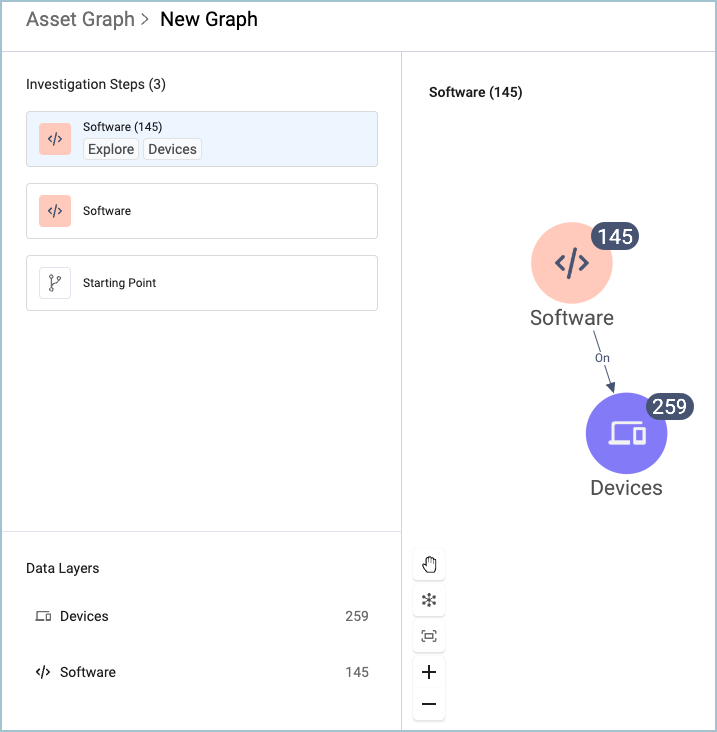
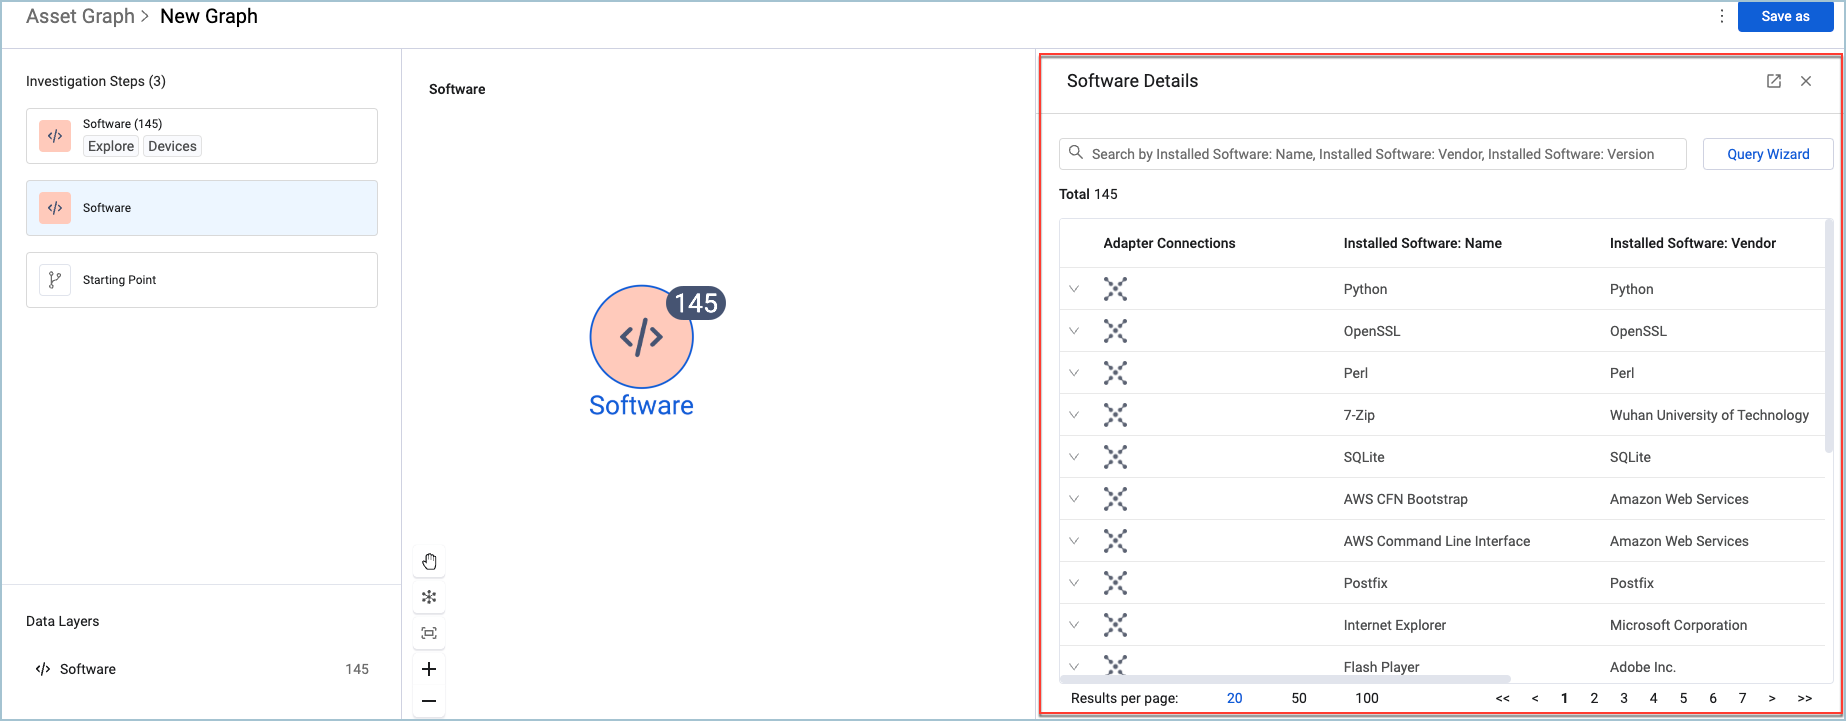
The drawers to the right open to reveal a list of assets represented by the node or options to explore relationships between assets.
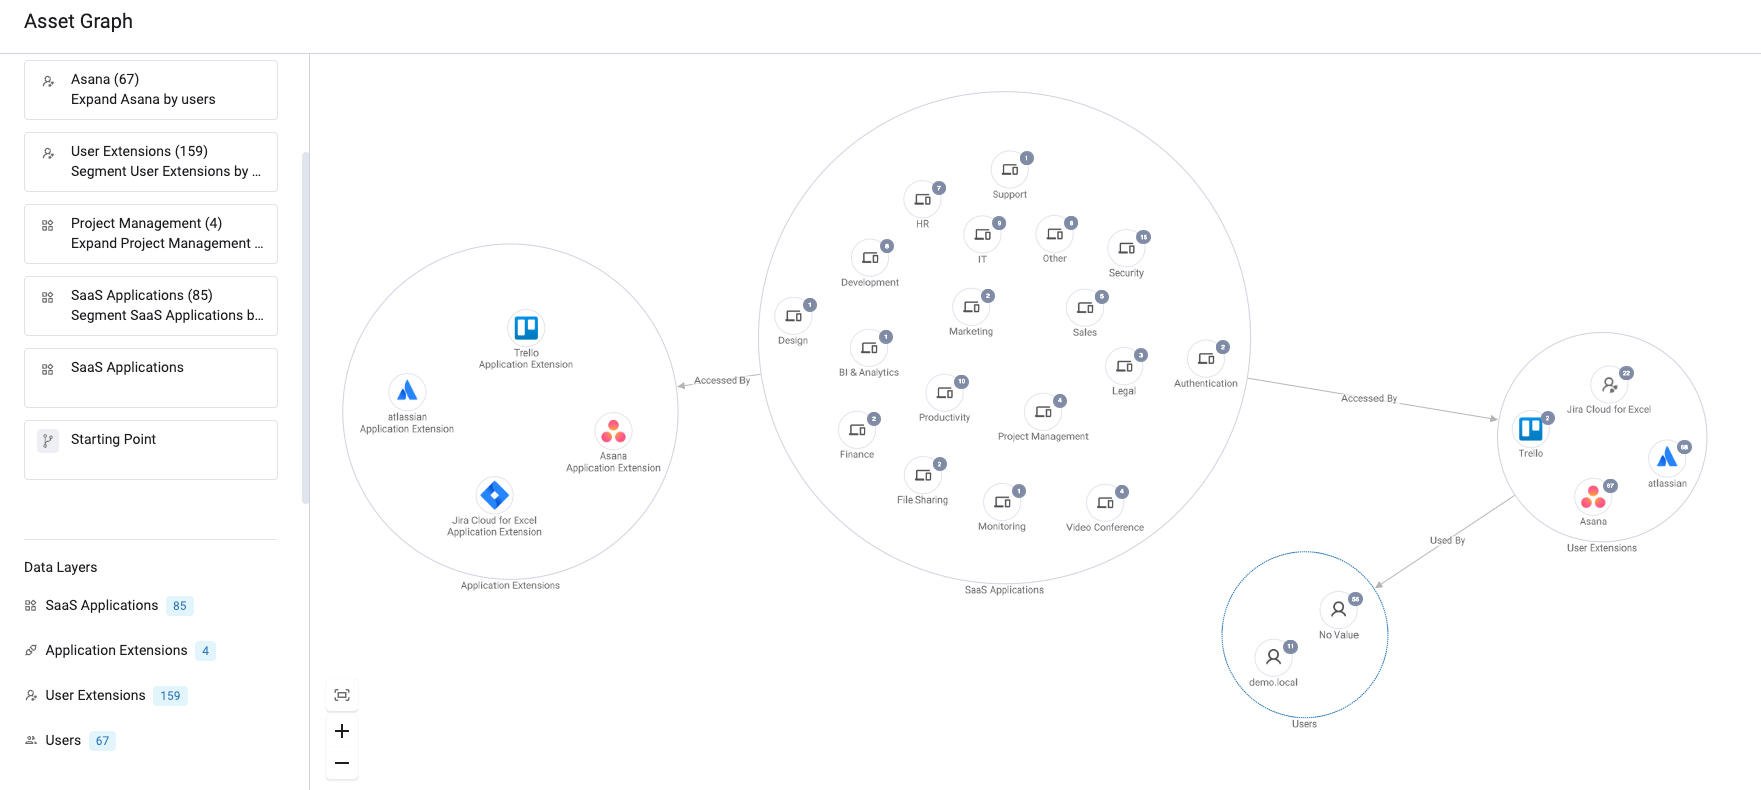
As you continue your investigation, assets and groups of assets are shown as circles with asset type icons.
Click on a node and select one of the options to investigate further.
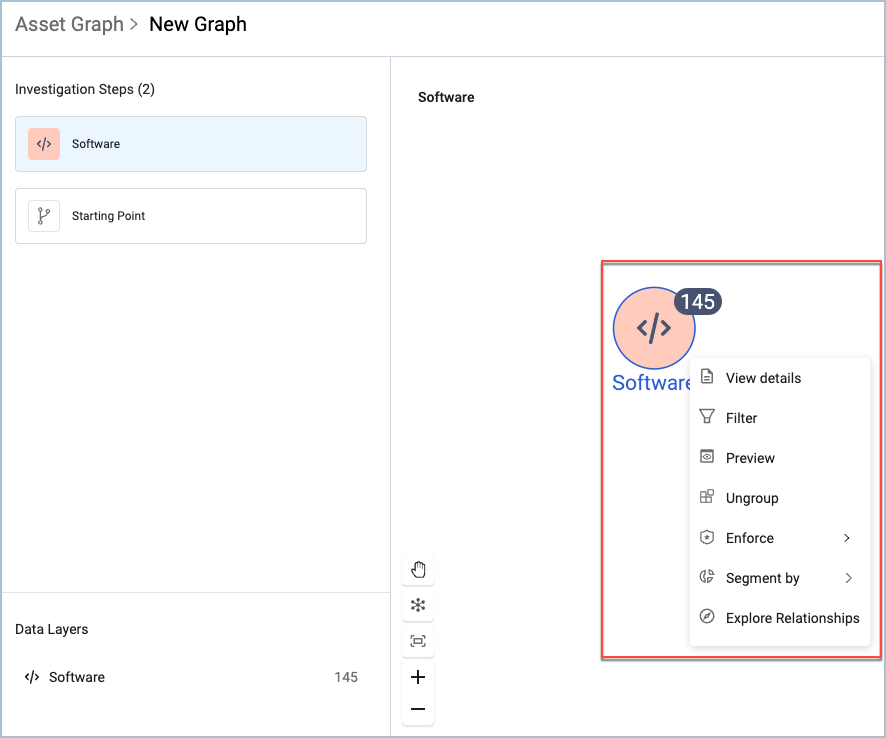
You can select:
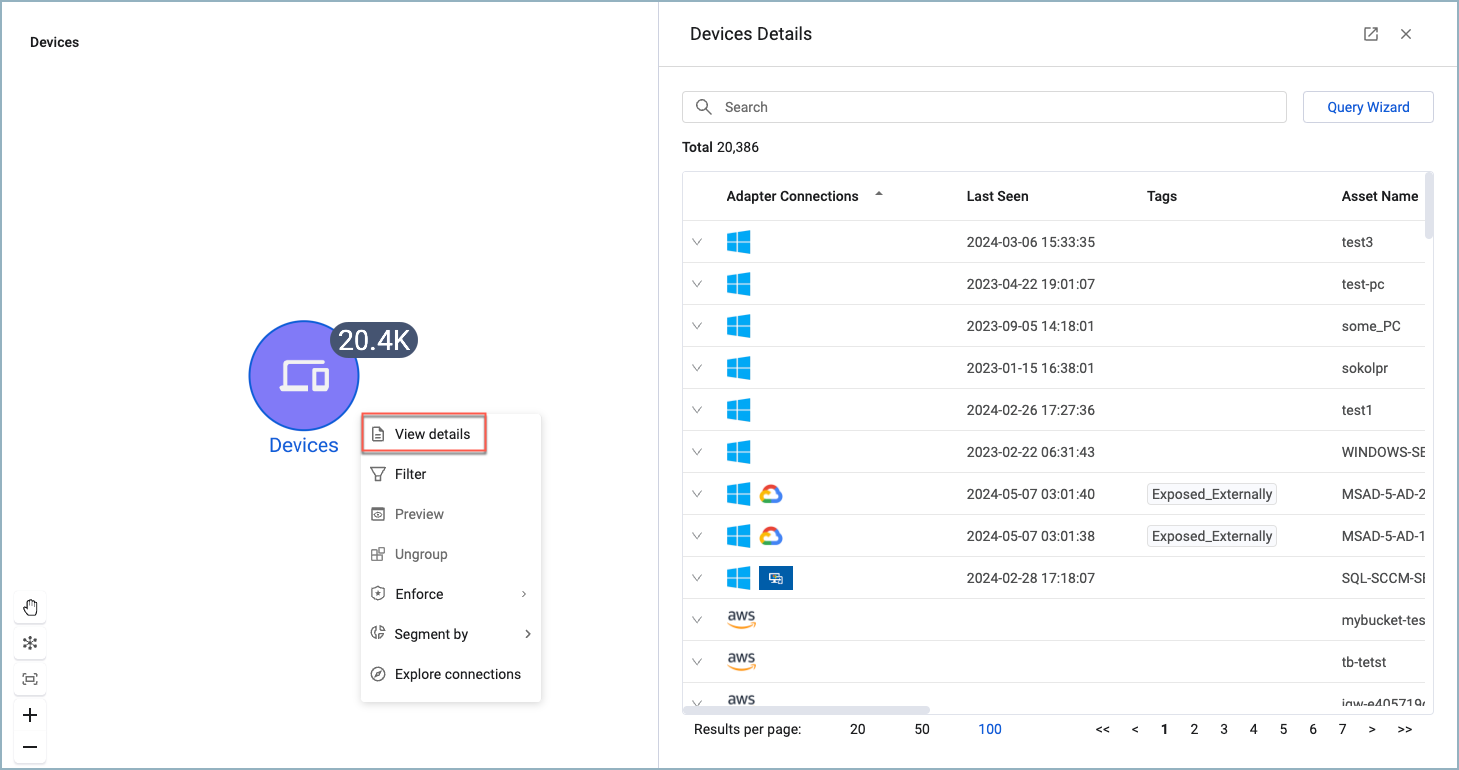
- View Details to see a list of assets represented by the node.
- Filter to further define what assets to include in the graph.
- Preview to temporarily open the node and view all the assets represented by it. Only for nodes with less than 500 assets.
- Ungroup to ungroup the node and view and investigate the assets as individual nodes.
- Enforce to create an Enforcement Action on the selected assets.
- Segment by to fragment the node into separate nodes according to the selected field.
- Explore Relationships to view assets related to the displayed assets.
For more about working with the Asset Graph:
- Managing Asset Graphs
- Exploring Connections and Asset Relationships
- Saving, Loading and Updating Asset Graphs
- Importing and Exporting Asset Graphs
Viewing Investigations Step-by-Step
The Investigation Steps list in the side pane shows the sequence of steps taken in your investigation and allows you to view the progress step-by-step. Each action performed on the graph is represented by a tile in the Investigation Steps list. Keywords, such as action type and asset type or field, are shown as tiles.
The current step is highlighted blue. Each step tile includes a description of the step it represents. Hover over the tile to see the full description in a tooltip. Hover over a step tile to see the full name of the action taken when the name is long.

Clicking a step tile also recenters the graph.
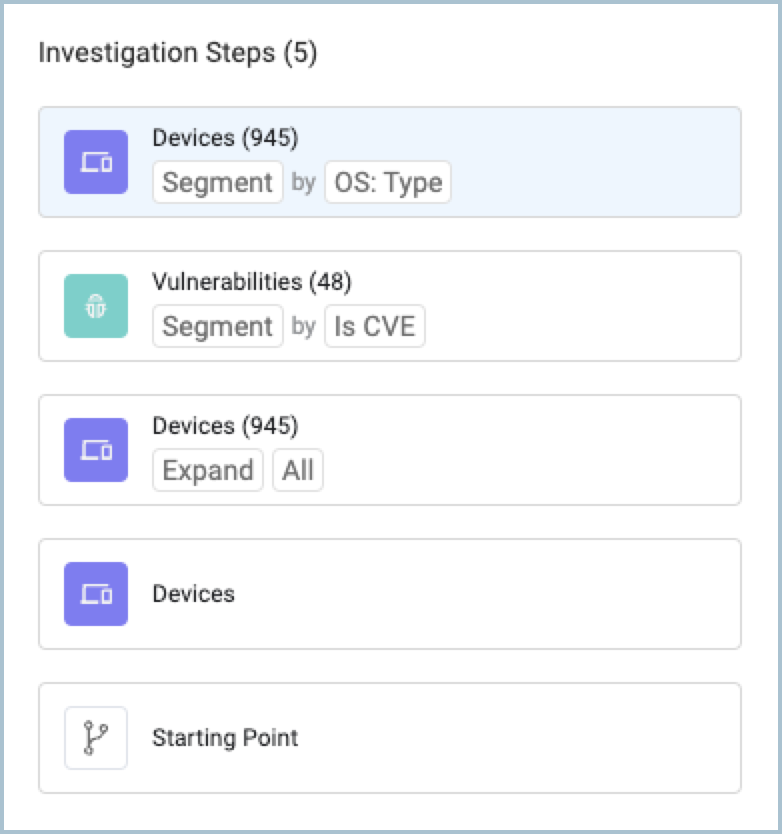
Click a step to view the graph at that stage of the investigation. Later steps are preserved and you can move through the steps as you want. This is useful to see the progression of the graph through the steps.
To return to the main Asset Graph view, click Starting Point in the Investigation Steps list or ![]() in the Navigation bar.
in the Navigation bar.
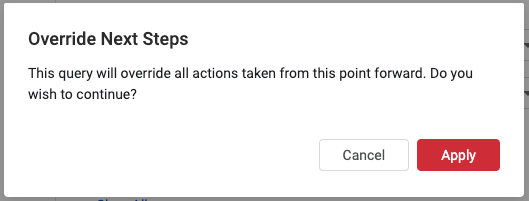
When a previous step is selected and you make changes for the next subsequent step, the following message appears:
When an investigation step could not be completed, the following is displayed:
.png)
The message details the last successful step, the failed step, the reason for the failure, and gives you the option to either start a new graph or continue from the last successful step.
When you start a new graph, the current graph is closed and, if not previously saved, all those steps are lost.
When you continue from the last successful step, the current graph is continued from the last step that completed successfully.
Viewing Data Layers
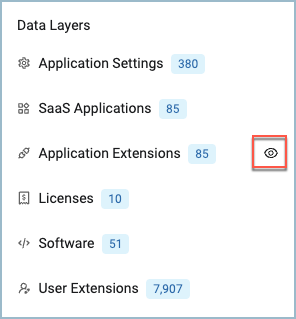
The Data Layers list at the bottom of the side pane shows each asset category included in the current state of the Asset Graph and the number of assets matching the current query parameters. When query parameters change, the asset count changes in the Data Layers menu to reflect the current query.
When you hover over a data layer, the view icon appears. Click the icon to show or hide the data layer.
Zooming In and Out
Use the zoom tools in the lower-left corner of the graph to magnify the graph. You can move the graph within the page to position it how you want and you can zoom the graph to focus on specific assets.
-
To move the whole graph, use the hand tool
 . Click in the empty space and drag. To move selected nodes, select the nodes you want and drag them to a new location. Learn more on how to select multiple assets.
 -
Click
 to set the view to fit the graph in the visible window.
 -
Click
 to zoom in and
  to zoom out. You can also use the mouse wheel to zoom the graph.
Viewing Relationships between Assets
Relationships between assets and/or groups are shown as arrows linking them. It describes how the assets are connected.
See Exploring Connections and Asset Relationships for more about working with connections and relationships.
Viewing a Group Preview
For groups of less than 500 assets, you can display all group members individually as a preview.
To view a preview of an asset group:
- Click on the node and select Preview. The group is opened and the members are enclosed within a circle.
- To close the preview, click within the group circle and select Close preview to go back to the group icon.
Ungrouping a Group Node
Groups of less than 500 members can be ungrouped. When a node is ungrouped, all the members are displayed on the graph individually.
To ungroup a group node:
- Click on a group node and select Ungroup.
Viewing the Asset Profile
When you hover over the icon of a single asset, a tooltip appears with information about that asset.
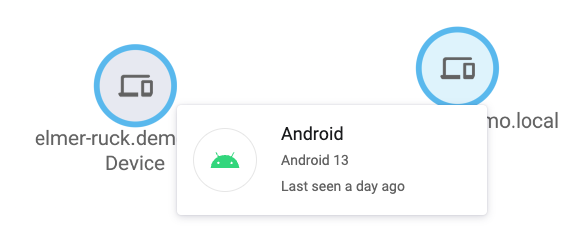
Click on the asset icon for other options:
- View asset profile - Displays the Asset Profile page in a new tab for the selected asset in a new browser tab.
Segmenting a Group of Assets
You can segment a group of assets by various fields to separate them into categories.
To segment an asset group:
-
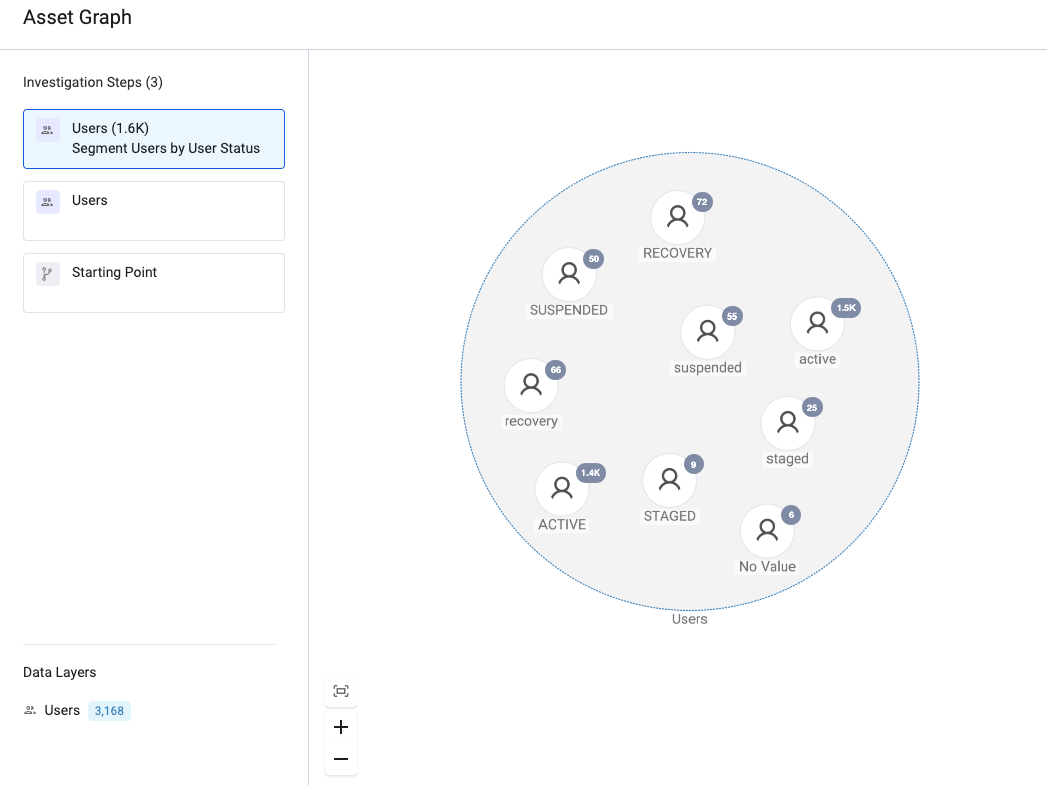
Click Segment by and select a field to segment the group. Subgroups of the assets are displayed according to the field selected. For example, segmenting SaaS Applications by Application Category.
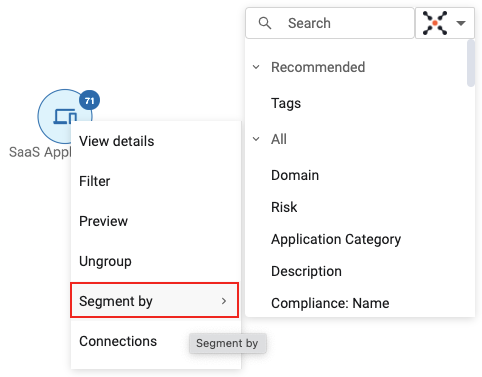
For example, segmenting SaaS Applications by Application Category creates groups of SaaS applications for each category. Each of these groups can also be segmented and investigated further.
Selecting Multiple Nodes
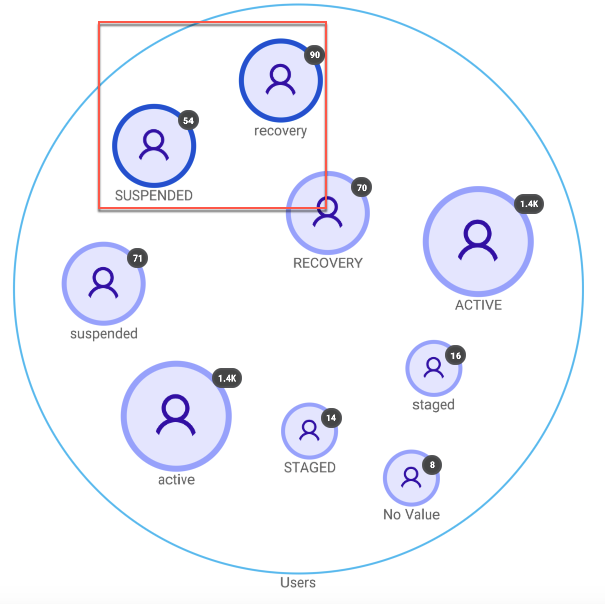
You can select multiple assets or asset groups in the Asset Graph and investigate them together.
To select multiple assets:
- Do one of the following:
- On all OSs, click the
 till it turns to
  . Then, click and drag the border around the nodes you want to select.
 - On Windows and Linux machines, press CTRL; on Apple macOS machines, press Command. and click on the nodes you want to select.
- On all OSs, click the
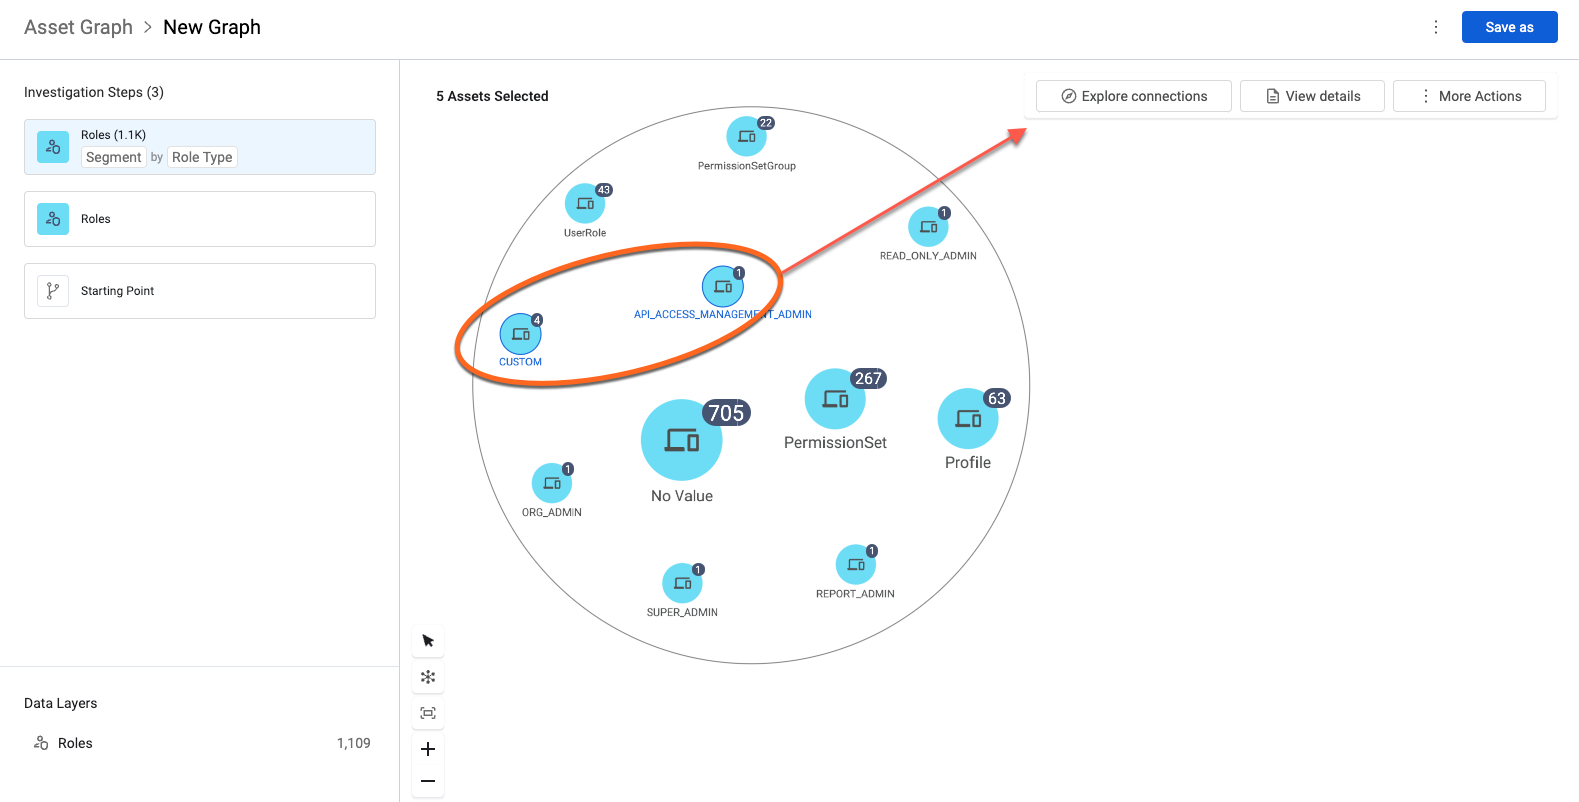
When you select multiple nodes on a graph, the Actions appear in the upper-right corner.
Creating Custom Node Groups
Use custom groups to associate individual assets or groups of assets together. Groups reduce clutter in your graph, and enable you to act on the whole group as a single entity. Groups can only include assets of the same type. Enforcement Actions are executed on all members of a group.
For example, you can select all the user nodes that belong to the same department, group them together.
Expanding a group's connections shows the connections for all the members of the group.
To group assets on the asset graph
- Select the assets you want to group.
- In the menu, select Group.
- The selected nodes are grouped together into one node and named in sequence with the asset type added.
.png)
To ungroup an asset group
- Click on a group and select Ungroup.
Note
When ungrouping nested groups, only the outermost group can be ungrouped.
Viewing Node Details
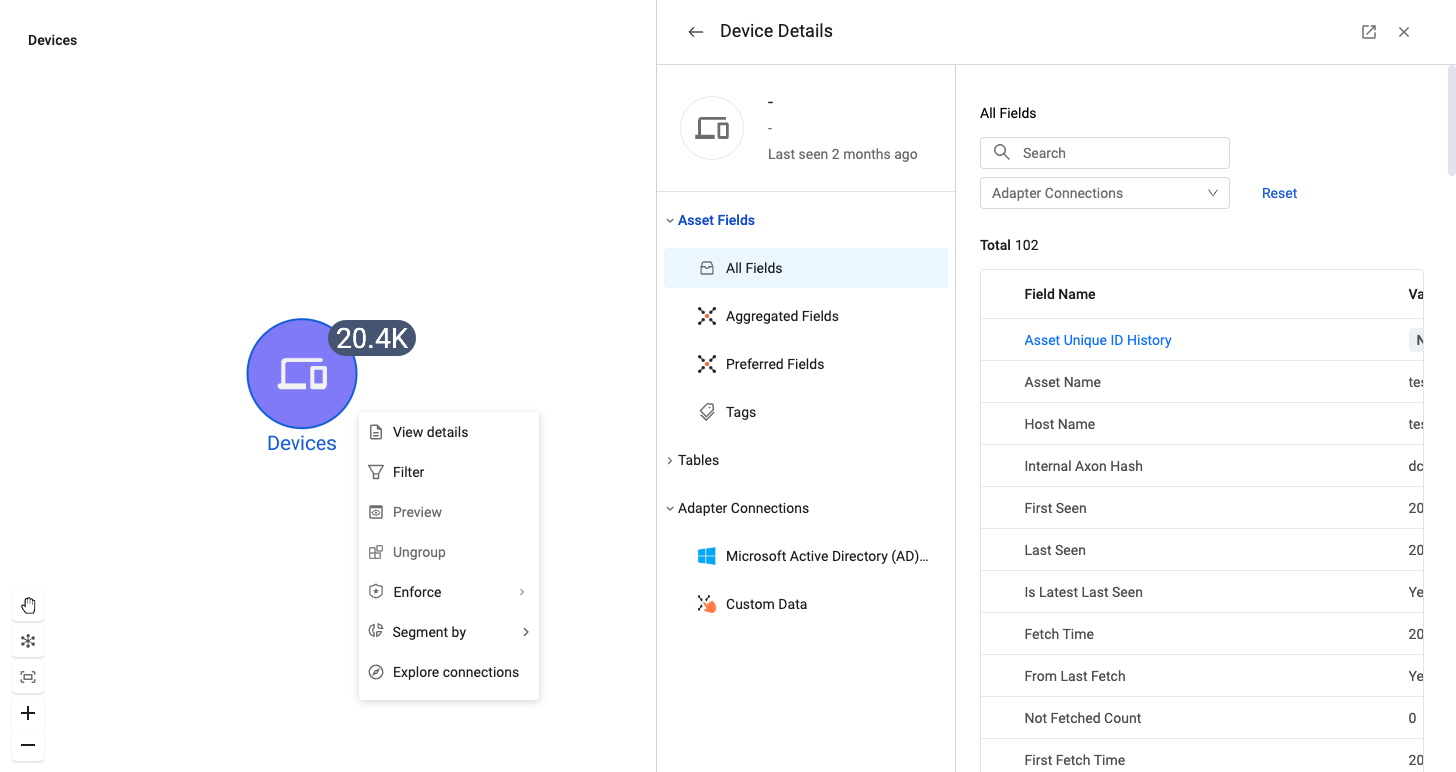
Use the Group/Asset Details drawer to view more details about the selected node. For group nodes, a list of member assets is displayed. Click on an individual asset to see the Asset Profile page for that asset.
For individual assets, the Asset Profile for that asset is displayed.
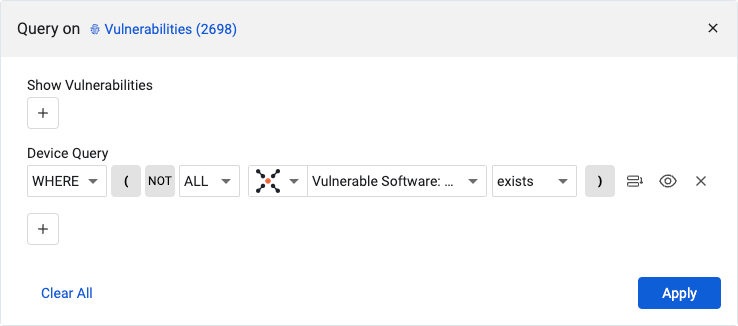
Use the Search bar to find specific assets within the current list or click Query Wizard to use different query parameters.
The Query Wizard opens with the current query parameters. Make any changes you want and click Apply. Assets matching the new parameters are listed in the Explore Group drawer and in the Asset Graph. See Creating Queries with the Query Wizard for more about creating queries.
To view node details:
- Click on a node in the Asset Graph and select View Details for group nodes, or View Asset Profile for individual assets.
With the exception of managing custom fields and tags and viewing charts, all the functionality of the Asset Profile page can be accessed here in the Details drawer.
See the Asset Profile page for more information.
Filtering Asset Groups
You can filter a group to see a more specific set of assets.
-
Select a group and click Filter Group to open the Query Wizard.
The Query Wizards opens on the query that describes the group you clicked on. The number of assets in the group appears at the top of the wizard.
-
Change the query parameters to filter the group and click Apply. The Asset Graph and the asset count at the top of the wizard update to reflect the new parameters and a new breadcrumb is added. See Creating Queries with the Query Wizard more information on how to use the Query Wizard.
When a filter is applied to a group, the filter icon appears on the group icon.

Using Enforcement Actions from the Asset Graph
You can use an existing Enforcement or create new ones directly from the Asset Graph.
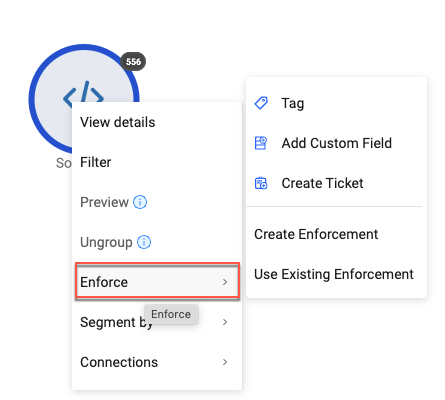
To use an Enforcement Action in the Asset Graph
- Click on the asset or asset group on which you want the Enforcement Action to apply.
- From the Enforce option, select one of the following:
- Create Enforcement- To create a new Enforcement Set, see Enforce - Create Enforcement in Asset Actions.
- Use Existing Enforcement - To use an exising Enforcement, see Enforce - Use Existing Enforcement in Asset Actions.
Tags, Custom Fields and Create Tickets from the Asset Graph
You can also assign tags, add custom fields and create tickets directly from the Asset Graph.

Updated about 2 months ago
