
Viewing Workflows Run History
The Workflow Run History page provides a comprehensive and transparent view of all past Workflow runs, allowing you to quickly identify issues, analyze performance, and build trust in your automations.
The detailed run history helps you:
- Identify and diagnose errors in past Workflow runs.
- Analyze executed Workflows to find bottlenecks and areas for optimization.
- Gain insight into system activity through transparent, detailed logging.
Accessing the Run History
You can view the run history for all Workflows or for a single, specific Workflow.
To view all runs for all Workflows
- In Axonius New Navigation Experience, access Run History from the Action Center menu, under Action Center Tools.
- From the main Workflows page, click Run History in the top-right corner. The Run History page opens, displaying a table with run details of all Workflows defined in the system.
To view the runs for a single Workflow
- In the Workflows table, click the desired Workflow.
- On the Workflow's summary page that opens, click View Runs in the top-right corner.
- The Run History - Workflows tab opens, automatically filtered to show runs only for that Workflow. The Workflow Name appears in the filter dropdown. You can select other Workflows from this dropdown to view their run history as well.

The Run History Page
The Run History page lists all Workflow runs (or those of a selected Workflow), allowing you to investigate the results and details of each run.
The Run History page consists of the following main elements:
- Search/Filter bar
- Run History table
- Actions (specifically, Terminate Task)
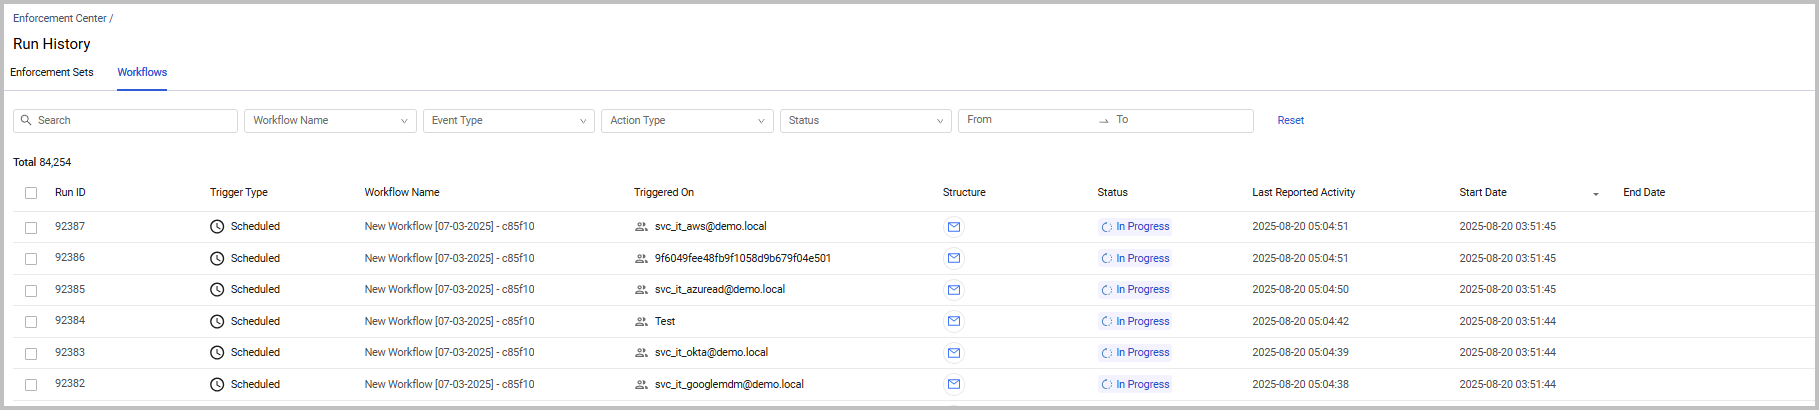
Run History Table
The Run History table displays a list of Workflow runs, with one row representing each run. The table is updated each time a Workflow is triggered by an Event or Action.
The total number of times the Workflows in the table have been triggered is shown as Total (<# of runs performed>). This number increments by one each time a Workflow is run.
Note
Limitation: If a Workflow run starts on an asset that is later removed from its defined scope, the run still completes, and the asset is listed in the Run History.
The Run History table includes the following fields for each Workflow run:
-
Run ID - The unique ID number of the run.
-
Trigger Type - The icon and name of the Workflow trigger type (Manual, Scheduled, or Event).
-
Workflow Name – The default or assigned name of the Workflow.
-
Triggered On – This can be one of the following:
- The asset on which the event or action was triggered.
- No assets - Workflow was triggered by one of the following:
- An action whose query (built with the Query Wizard) resolved no assets.
- An event that resolved no assets. Learn about how triggering Events with no assets trigger Workflows.
-
Structure - Displays icons representing the sequence of nodes the run traversed. Hover over the icons to view the Workflow canvas.
-
Status - The final status of the most recent Workflow run. For example, if an Add Tag to Asset action is currently running in the workflow, the current status of this action is displayed. Available statuses are:
- Awaiting - The Workflow is waiting for an event or action to proceed (e.g., waiting for an external system response or a scheduled time). The Workflow changes to this status after a certain amount of time that the run is In Progress and doesn't automatically move to another status.
- Delayed - The Workflow reached a Delay node and is paused.
- Completed - All events and actions finished without errors.
- Failed - The Workflow run failed because one or more actions did not complete successfully.
- In Progress - The Workflow is currently running.
- Partially - The Workflow finished, but one or more actions failed.
- Terminated - The Workflow run was manually stopped by a user.
- Timed Out (in red) - An Event configured with a Timeout but no defined Timeout condition reached its time limit, and the Workflow was automatically terminated.
-
Last Reported Activity - The date and time (in UTC) that the latest node completed running. Updated each time a node is completed.
-
Start Date – The date and time (in UTC) that the Workflow was triggered.
-
End Date – The end date and time (in UTC) when the entire Workflow run was completed. This field is populated only after the run has completed.
Filtering the Run History Table
You can filter the Run History table using the Search bar and the following filters:
- Search - Enter text to search across relevant text fields in the table.
- Workflow Name - Filters by Workflow name.
- Event Type - Filters by Events in the Workflow.
- Action Type - Filters by Enforcement Actions in the Workflow.
- Status - Filters by the current status of the run.
- From, To - Filters for Workflows that were run during the specified period.
* Click **From** and select the date and optionally the time (right pane) from which to display results. Repeat for **To** and then click **OK**.
* Both **From** and **To** dates must be filled in and be earlier than or on the current date.
* Click the arrows to the left/right of the Month/Year header to open the previous/next month's or year's calendar page.
* To filter results only for a specific date, select the same date twice.

<Image align="center" border={false} src="https://files.readme.io/6b19ca195289e1ee67a949b991005bec6fc46d86a40a9b080d92b17d01ead376-FromToFilter.png" />
You can click the following to perform quick actions on filters:
- Select All - Selects all options in a specific filter.
- Clear All - Clears all selections in a specific filter.
- Reset - Clears all filters and displays the entire table.
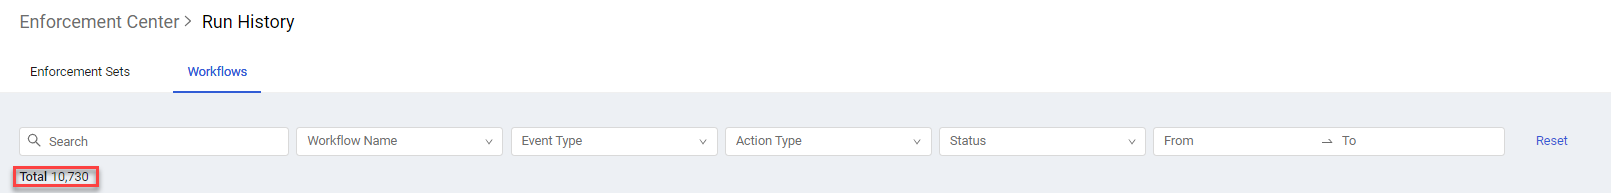
The total number of Workflow runs that match your search criteria is displayed in the top-left side of the Run History table just under the Filter bar. When no search criteria are selected, the total results represent the total number of runs.
Viewing Detailed Run Information
Clicking any row (representing a Workflow run) in the Run History table opens a drawer with detailed information about that specific run. 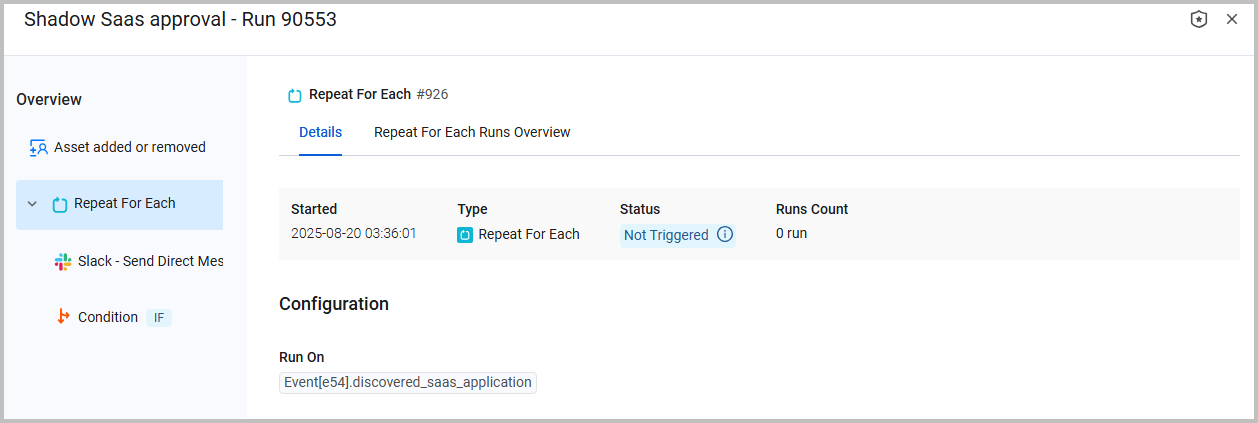
The Run drawer has two panes:
- Overview panel - The left pane shows the detailed path of the Workflow's completed steps (nodes) in the order they were run. Nodes are added to this panel only after they have finished running.
- Node Details panel - The main pane displays detailed information for the node selected in the Overview panel. This includes the node's name, its unique ID (system-generated UUID preceded by #), run data, and configuration details. The information shown in this pane varies depending on the type of node selected (e.g., Condition, Action, or Event).
Note
The node UUID is displayed so that you can recognize the Workflow Data repository field values from the corresponding node.
Summary of Information for Various Node Types
The following summarizes the information displayed for various node types:
- Action node - Displays when the action Started, Ended, the Type (Action), its Status, and the name of the Affected Asset or number of Affected Assets (Successful and Failed). It also displays the Dynamic Values Configuration (if configured), and the action Configuration.
- Clicking the Affected Asset link opens the Asset Profile page of the affected asset. Clicking the number of Affected Assets opens the Assets page listing these assets.
- Action status can be any of the following:
- Success - The action succeeded.
- Failure - The action failed.
- Not Triggered - The node was not reached during the Workflow run.
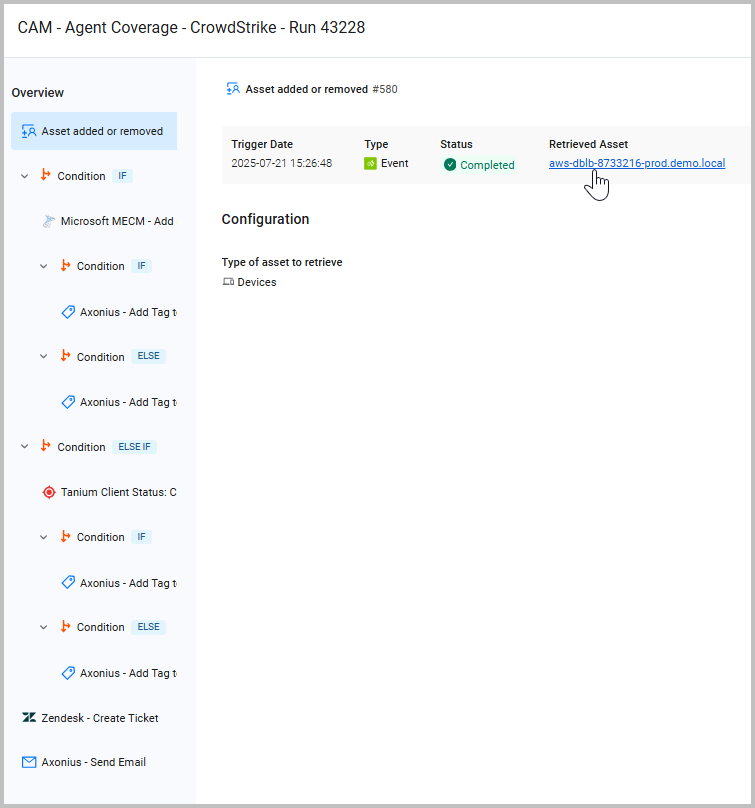
- Event node - Displays the Trigger Date, Type (Event), Status, and Retrieved Asset (for a triggering node). It also displays the Event Configuration, including the Type of asset to retrieve and Event fields, if they exist. It also shows the configuration of parsed Event string fields.
- Clicking the Retrieved Asset link opens its Asset Profile page.
- Event status can be any of the following:
- Awaiting - Status of the last event of a run that is in Awaiting status.
- Timed Out (with gray shading) - The last event of a run, configured with Timeout but without a Timeout Condition, has reached its timeout limit.
- Completed - Status of the event if the run is not Awaiting or Timed Out.
- Not Triggered - The node was not reached during the Workflow run.
- Delay node - Displays when the delay Started, Ended, the node Type (Delay), and its Status. It also displays the Configuration of the node, including the Delay period.
- Condition node - Displays the type of condition (IF, ELSE, ELSE IF) and its Configuration.
- Write to data repository node - Displays when the variables Started and Ended to be written to the repository, Type (Write to data repository), and its Status. It also displays the Configuration of each Variable in a separate tab.
- Repeat For Each node - Contains Details and Repeat For Each Runs Overview tabs.
- Details tab - Shows when the node was Started, its Type (Repeat For Each), Status, and Run Count. It also shows the Configuration of the node, including the asset it runs on (Run On).
- Repeat For Each runs Overview tab - Displays a table of all the Repeat For Each loop runs with columns: Run ID, Triggered On, Run Status, Duration, Last Reported Activity, Start Date, and End Date. It also includes a filter (above the table) to Search Runs for specific text, Event Type, Action Type, Status, Start time, and End time.
- Each node in the Repeat For Each loop - Contains a Details for the node and Repeat For Each Runs Overview tabs.
- Details tab - Shows details according to the Type (Action, Event, Condition, etc.). For example, for an Action node, shows when it Started, Ended, its Type, Status, and Run Count. It also shows the Configuration of the node.
- Repeat For Each runs Overview tab - Includes a table of all the Repeat For Each runs with columns: Run ID, Run On, Run Status, Start Date, and End Date. It also includes a filter (above the table) to Search Runs for specific text, Status*, Start time, and End time.
Note
If the running of a node results in an error (Failed), a Run Error is displayed in the drawer (in pink).
If the number of incoming events exceeds the maximum allowed, event overflow occurs. In this case, an error states that the event was dropped because it exceeded the rate limit.
If the Status of a node is Not Triggered, this means that this node was not reached during the Workflow run.
Click the Go to Workflow icon
in the drawer header to open the detailed configuration of the Workflow.
The last event of a run acquires the status of the run. Meaning that if the entire run times out, the last event in that run acquires the status 'timed out'.
A node is added to the Run drawer's Overview pane only after the node has finished running and its status is finalized. This means you'll see a node appear as the workflow progresses through its stages.
Viewing an Asset's Run History
From the Run drawer, click the links for Affected Asset (for an Action) or Retrieved Asset (for an Event) to open the Asset Profile page for that asset. 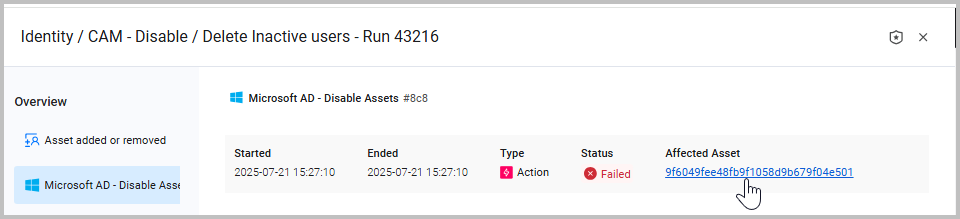
On the Asset Profile page, click the Enforcement Runs tab to view a history of all Action Center activities related to this asset, including enforcement set and workflow runs. To learn more, see the Asset Profile Page.
Updated about 2 months ago