Devices Page
The Devices page displays all the devices that were fetched for the query run. The query name is displayed above the search bar. If no query was chosen, the page displays all devices.
To open the Devices page, click the Assets icon and from the left-pane, under Compute, select Devices.
.png)
Devices Fields
The Devices page displays a wide range of fields that provide information about the devices on your system. The following columns are displayed by default:
-
Adapter Connections - The Adapter Connections column displays the icons of the adapter connections that this device was seen from, and is considered by Axonius as the correlation of data from different adapters to the same device.
For example, a device that was fetched and correlated from the following adapter connections:
.png)
- Microsoft Active Directory (AD)
- Amazon Web Services (AWS)
- VMware Carbon Black EDR (Carbon Black CB Response)
- CrowdStrike Falcon
- Cybereason Deep Detect & Respond
- CylancePROTECT
- Trend Micro Deep Security
- Kaseya VSA
- SolarWinds Network Performance Monitor
-
Asset Name - The name of the Asset.
-
Host Name - The name of the host
-
Last Seen - The time and date the asset was last seen. When each adapter may fetch a different time, the latest time is displayed.
-
Network Interfaces: MAC - MAC address of the device.
-
Network Interfaces: IPs - IP address of the device.
-
OS: Type - Operating system
-
Tags - Tags added to the device. Learn more about Tags.
Creating Queries
Use the Queries to create granular queries to understand how assets adhere to their policies. You can define a wide variety of filters, from which you can easily drill down to the assets that match the required search criteria. You can create queries on Devices using one of the following modes:
-
Query Wizard (the default) - Create a query using the Query Wizard, or in the query bar, selecting a saved query or writing a query.
-
Basic mode - Create a query by selecting filters.
Use either of these modes to create a unique set of queries.
Learn more about how to create Queries using the Query Wizard and how to create Queries in Basic mode.
Viewing Query Results
The total number of devices collected for that query (or for all collected devices when no query is present) is displayed on the top left side of the table:
.png)
A number of columns are displayed for each device. The first column is the Adapter Connections column.
Expanding Device Data
Click .png) to the left of the Adapter Connections column to expand the device record and to display device 'uncorrelated' data, i.e., the device data per adapter. This functionality provides you with a single view and an easy way to identify the source for each of the different device field values. Click again to collapse the device data.
to the left of the Adapter Connections column to expand the device record and to display device 'uncorrelated' data, i.e., the device data per adapter. This functionality provides you with a single view and an easy way to identify the source for each of the different device field values. Click again to collapse the device data.
.png)
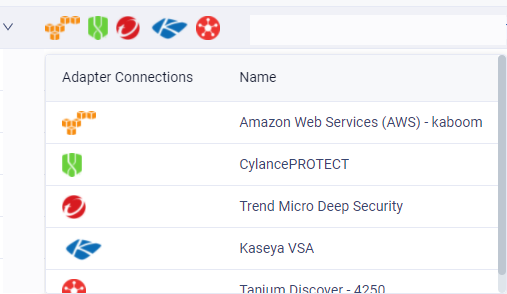
Hover over the Adapter Connections column to see the adapter name for all adapter connections in a tooltip. If you defined an Adapter Connection Label on the adapter connection configuration it will be concatenated to the adapter name value. This can help distinguish between two adapter connections from the same adapter.

Expanding Aggregated Field Data
There are two types of devices columns:
- Aggregated data fields - a common field which contains data fetched from different adapters. For example, Host name, MAC address, OS type and many more.
- Specific data fields - a unique field which contains data fetched from a single adapter source. For example, "Region" field from Amazon Web Services (AWS).
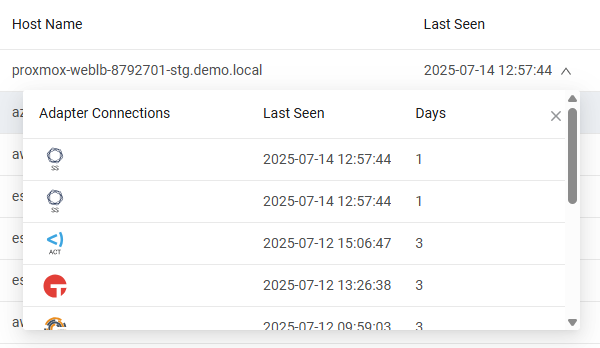
Click  in any generic data field to view a tooltip with the field's 'uncorrelated' data, i.e. device specific field data for that asset entity / adapter connection. Click
  to collapse the tooltip.
For example, if you expand the 'Last Seen' field, you can see when the device was seen by each of its source adapters. Mouse over the number of additional parameters to display a context menu showing the first 10 parameters in this field. You can scroll through the data. For fields with multiple values, you can click the copy icon to copy the values to the clipboard.

Viewing Complex Fields on the Asset Profile Page
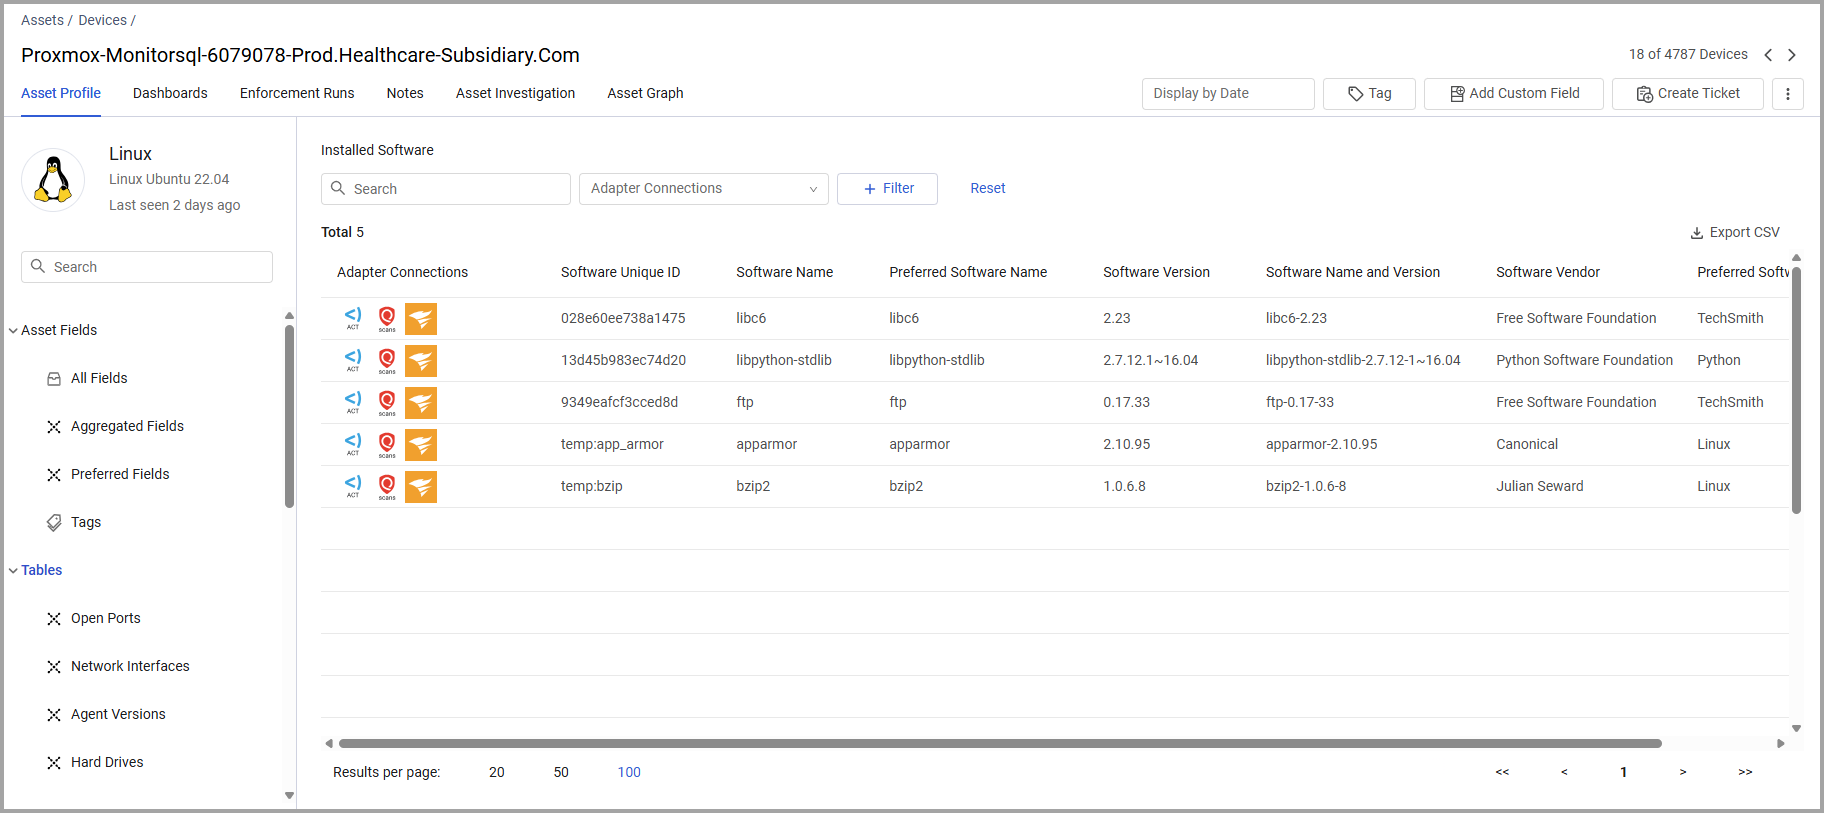
Complex fields are fields which can display a number of parameters. For instance, the Installed Software field can contain the Software Version field, the Software Name field, Software Vendor field and more. In Complex fields, the system displays the first few parameters in the field, and then displays the number of additional parameters.

Mouse over the number of additional parameters to display a context menu showing the first 10 parameters in this field. You can scroll through the data.

Click View all results to open the data in the Asset Profile page, open at that complex field presented as a table.

Setting Page Columns Display
Not all fields are displayed by default. Use Edit Columns to add or remove columns and freeze specific columns so that they are not scrolled. The Adapter Connections column is frozen by default. Refer to Setting Page Columns Display.
Performing Actions on Devices
Select one or more devices and use the options in the Actions menu to perform various actions. Refer to Asset Actions.
Investigating Assets
Select Asset Investigation to see the changes over time for all the devices or users in the system. Learn about Asset Investigation.
OS End of Life, End of Support, and Latest OS Version
You can create queries to find End of Life and End of Support for various OS versions using 'Preferred OS: End of Life' or 'OS: End of Life' and 'Preferred OS: End of Support' or 'OS: End of Support' . End of life and End of Support are aggregated values enriched by Axonius https://endoflife.date/. Devices are enriched with data about the End of Life and End of Support for operating systems running on them. End of Life and End of Support is supported for the following Operating Systems (OS):
- Windows Server
- Windows
- RedHat
- Ubuntu
- CentOS
- macOS
- iOS
- VMware
- Amazon Linux
- Linux Suse (End of Support not provided)
- PanOS
- AlmaLinux
- Oracle Solaris
- CentOS Stream
- FortiOS
- FreeBSD
- Rocky Linux
- Debian
- Oracle Linux
- IBM AIX
- openSUSE
- SLES
- NetBSD
Note
For MacOS, you can only query deprecated releases for End of Life and End of Support date values. Future dates are not enriched.
You can also query devices for the 'Latest OS Version' to find out what the latest version of the operating system is and the 'Is Latest OS Version' field tells you if the device is running the latest version available for its OS.
Adding Risk Scores to Devices
You can use the Axonius - Calculate Risk Score Enforcement Action to calculate the risk score of each device that matches the Device query defined for the Enforcement Set, and write the calculated value to the Risk Score - Axonius calculated field per device field in the table on the Devices page. Learn how to view Risk Scores on the Devices page.
Displaying Historical Data
Axonius saves daily “snapshots” of all the collected data, which you can view for any query in the Devices page.
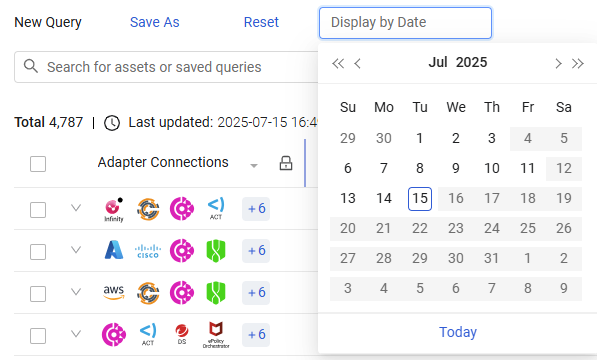
To view device query results for a specific date, click the calendar button or click 'Display by Date' on the top right corner above the query results table.

A date picker control opens, enabling you to select the desired data. By default, the latest day for which data was collected is displayed.

Notice that only dates with collected data are enabled as options for choice.
To clear the historical view and set back to latest, hover over the displayed date and click on the 'X' next to the displayed date.
Cancel Query
Cancel Query is displayed when you run a query. Click Cancel Query to revert to the results of the last successful executed query.
.png)
Last Updated Indication and Refresh Query
When query caching is enabled, and query results are retrieved from cache the Last updated indication is displayed. This indication specifies the last time the query was executed and from when the displayed query results are updated.
Use Refresh Query to run the query again to recalculate the query results.

Exporting Device and User Data to CSV
You can export the query results table data and its view (displayed columns) to a CSV file. Learn about exporting asset data to a CSV file.
For general information about working with tables, refer to Working with Tables.
Updated 2 months ago
