
Viewing Risk Score Results
The Risk Score of each asset is calculated in every discovery cycle, and the updated results is written into the Risk Score field.
You can view Risk Score results per Asset or per Security Finding per Asset.
Viewing Results per Asset
- After clicking Save and Run, wait for the Risk Score Enforcement Set to finish running. Then, navigate to the Enforcement Set's run history and click the most recent Enforcement Set run (row) to open its drawer.
- Click the green Successful link. The relevant Assets page opens. It lists the assets matching the query for which the Enforcement Action succeeded to calculate the Risk Score. For each asset, the EC: Result Details field shows
When there are assets for which the Enforcement Action failed to calculate the Risk Score, click the red Failed link to view them. You will be able to see the complete error message for each asset by hovering over the relevant row under the EC: Result Details field.
- Add the calculated Risk Score column to the table on the Assets page: select Edit Table
>Edit Columns, and from the fields that appear, add the Axonius Risk Score field (see Changing Columns Display to learn more).
.png)
- The Assets table displays the Axonius Risk Score column.
- To view assets' Risk Level, add the Axonius Risk Level field from the Edit Table dialog.
.png)
Viewing Results per Security Finding per Asset
-
Repeat steps 1-2 as explained above.
-
Select an asset from the relevant Assets page.
-
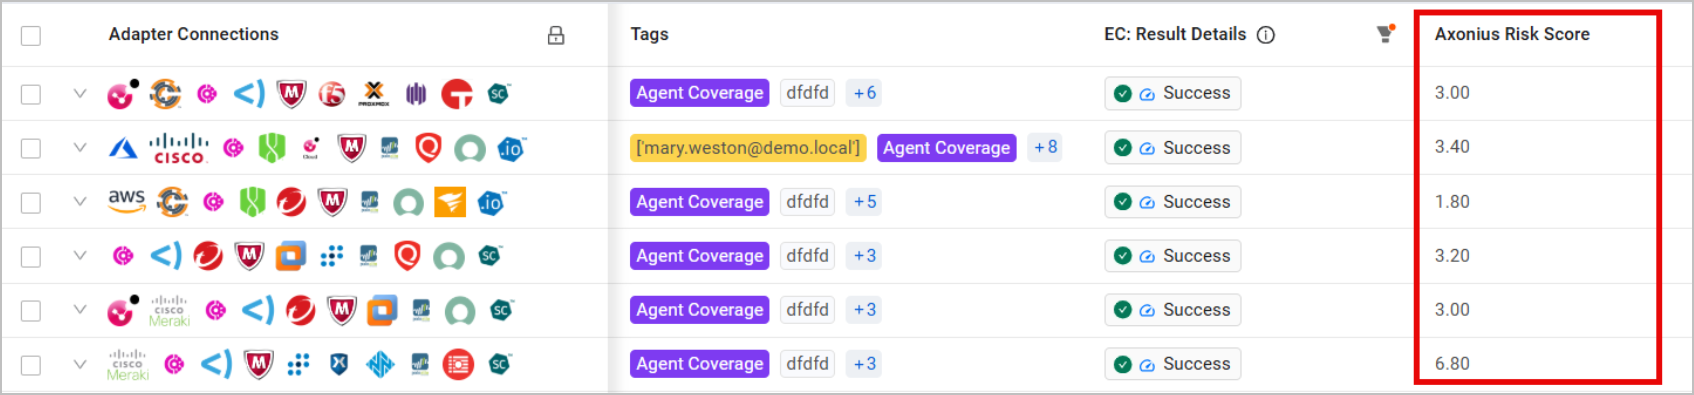
On the Asset's Profile page, from the left navigation panel, expand the Tables section and select Security Findings.
-
The Security Findings table opens, displaying the Axonius Risk Score and Axonius Risk Level fields for each security finding detected on the asset.
Risk Score Breakdown Display
After a Risk Score is calculated for an asset, its Asset Profile page provides a detailed breakdown of the data comprising the Risk Score. This ensures a transparent calculation process, and helps you to quickly detect any changes that need to be made to the Risk Score settings to get more accurate results.
Each row in the Risk Score breakdown table displays the following data:
- The Asset Type that the parameter is associated with (Device, Security Finding, etc.)
- The Source of the parameter - query condition or adapter connection
- The Parameter Name - for fields, the field name; for query conditions, the query name
- Calculated Value - The final, numeric value assigned to this parameter after normalization, standardization or applying fallback values
- The Weight (percentage) of this parameter in the calculation
Breakdown for Security Findings
To view Risk Score breakdown for Security Findings assets:
- Select an asset from the Security Findings Assets page.
- On the Asset's Profile page, from the left navigation panel, expand the Axonius Risk Score section (under the Tables section), and click Asset Risk Score.
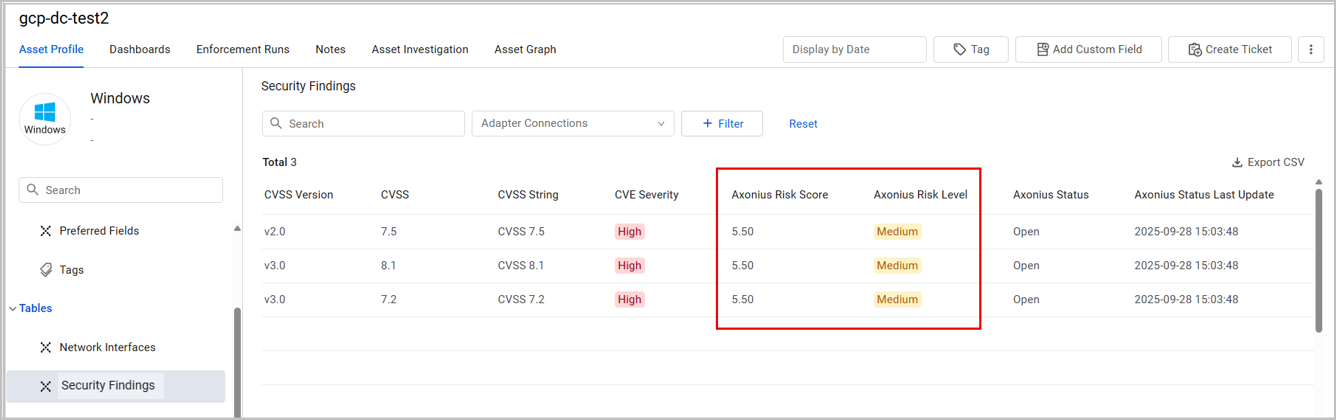
- The breakdown of the latest Risk Score calculated for this Security Finding is displayed.
- Additional information and options, demonstrated in the image below:
- The total Risk Score value of this asset (green arrow)
- The Risk Score Level of this asset (red arrow)
- An option to navigate to the Risk Score Settings page (blue arrow)
- An option to export the table to a CSV file (yellow arrow)
Alternative Field Notification (For Field Conditions Only)
In some cases, the calculation mechanism doesn't use the value of the original field defined, but the value of an alternative field defined as a fallback. Learn more about Field-Based Fallback Conditions.
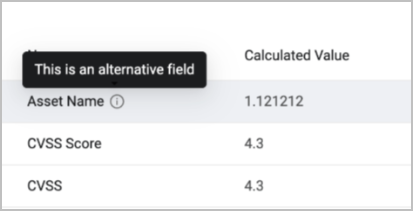
In this scenario, hovering over the Parameter Name in the Risk Score Breakdown table shows a note stating that this is an alternative field. This means that this isn't the original field the calculation was supposed to use, but a different field selected based on the defined fallback conditions.
Breakdown for Other Asset Types
The Risk Score breakdown for non-Security Findings assets depends on which calculation method you used.
- If you calculated the Risk Score per Asset, the Asset Profile page will display the Asset Risk Score breakdown,as demonstrated previously with Security Findings.
- If you calculated the Risk Score per Security Finding per Asset, the Asset's Profile page will display the Risk Score breakdowns of each Security Finding found on the asset. Follow these steps to view this information:
-
Select an asset from the relevant Assets page.
-
On the Asset's Profile page, from the left navigation panel, expand the Axonius Risk Score section (under Tables), and click Security Finding Risk Score.
-
The page shows breakdowns of the latest Risk Scores calculated for each security finding found on this asset. Each security finding has its own breakdown table. Navigate between the different security findings using the dropdown menu (marked in the image below).
-
Additional information and options - same as the Security Findings breakdown table.
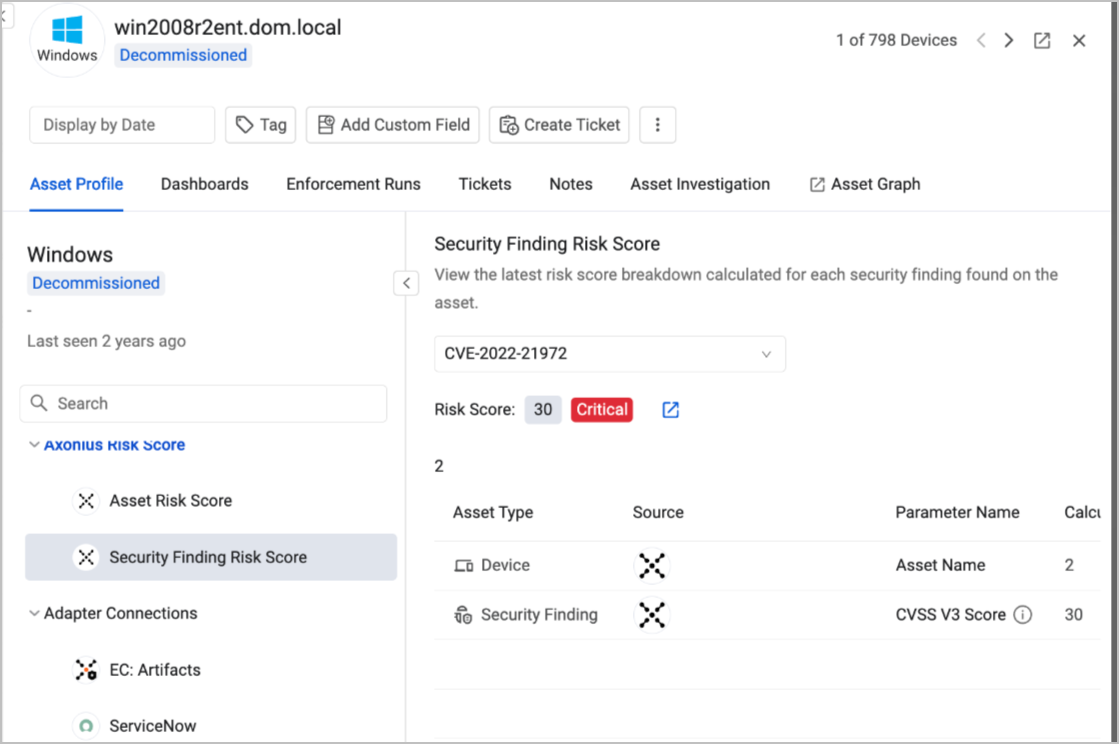
Note that in this example, the asset has both Asset Risk Score and Security Finding Risk Score breakdowns. This happens when you define Risk Scores both per Asset and per Security Finding per Asset.
No Risk Score Available Scenario
If no Risk Score has been defined for the asset yet, no Risk Score breakdown is available on its Asset Profile page. In this case, the Asset Risk Score/Security Finding Risk Score section is empty, and prompts you to define a Risk Score for this asset.
Updated 4 months ago