
Network Inspector Devices
Collecting asset data from IoT devices on a closed network, such as a healthcare system network (containing IoT/OT and IoMT devices), requires the Axonius Network Inspector, which is a physical server appliance. This device connects to the network to gather data for the Axonius platform. One or more Network Inspector devices can be used, depending on your network topology. For more information about the Axonius Network Inspector device and its deployment, see Axonius Network Inspector Deployment .
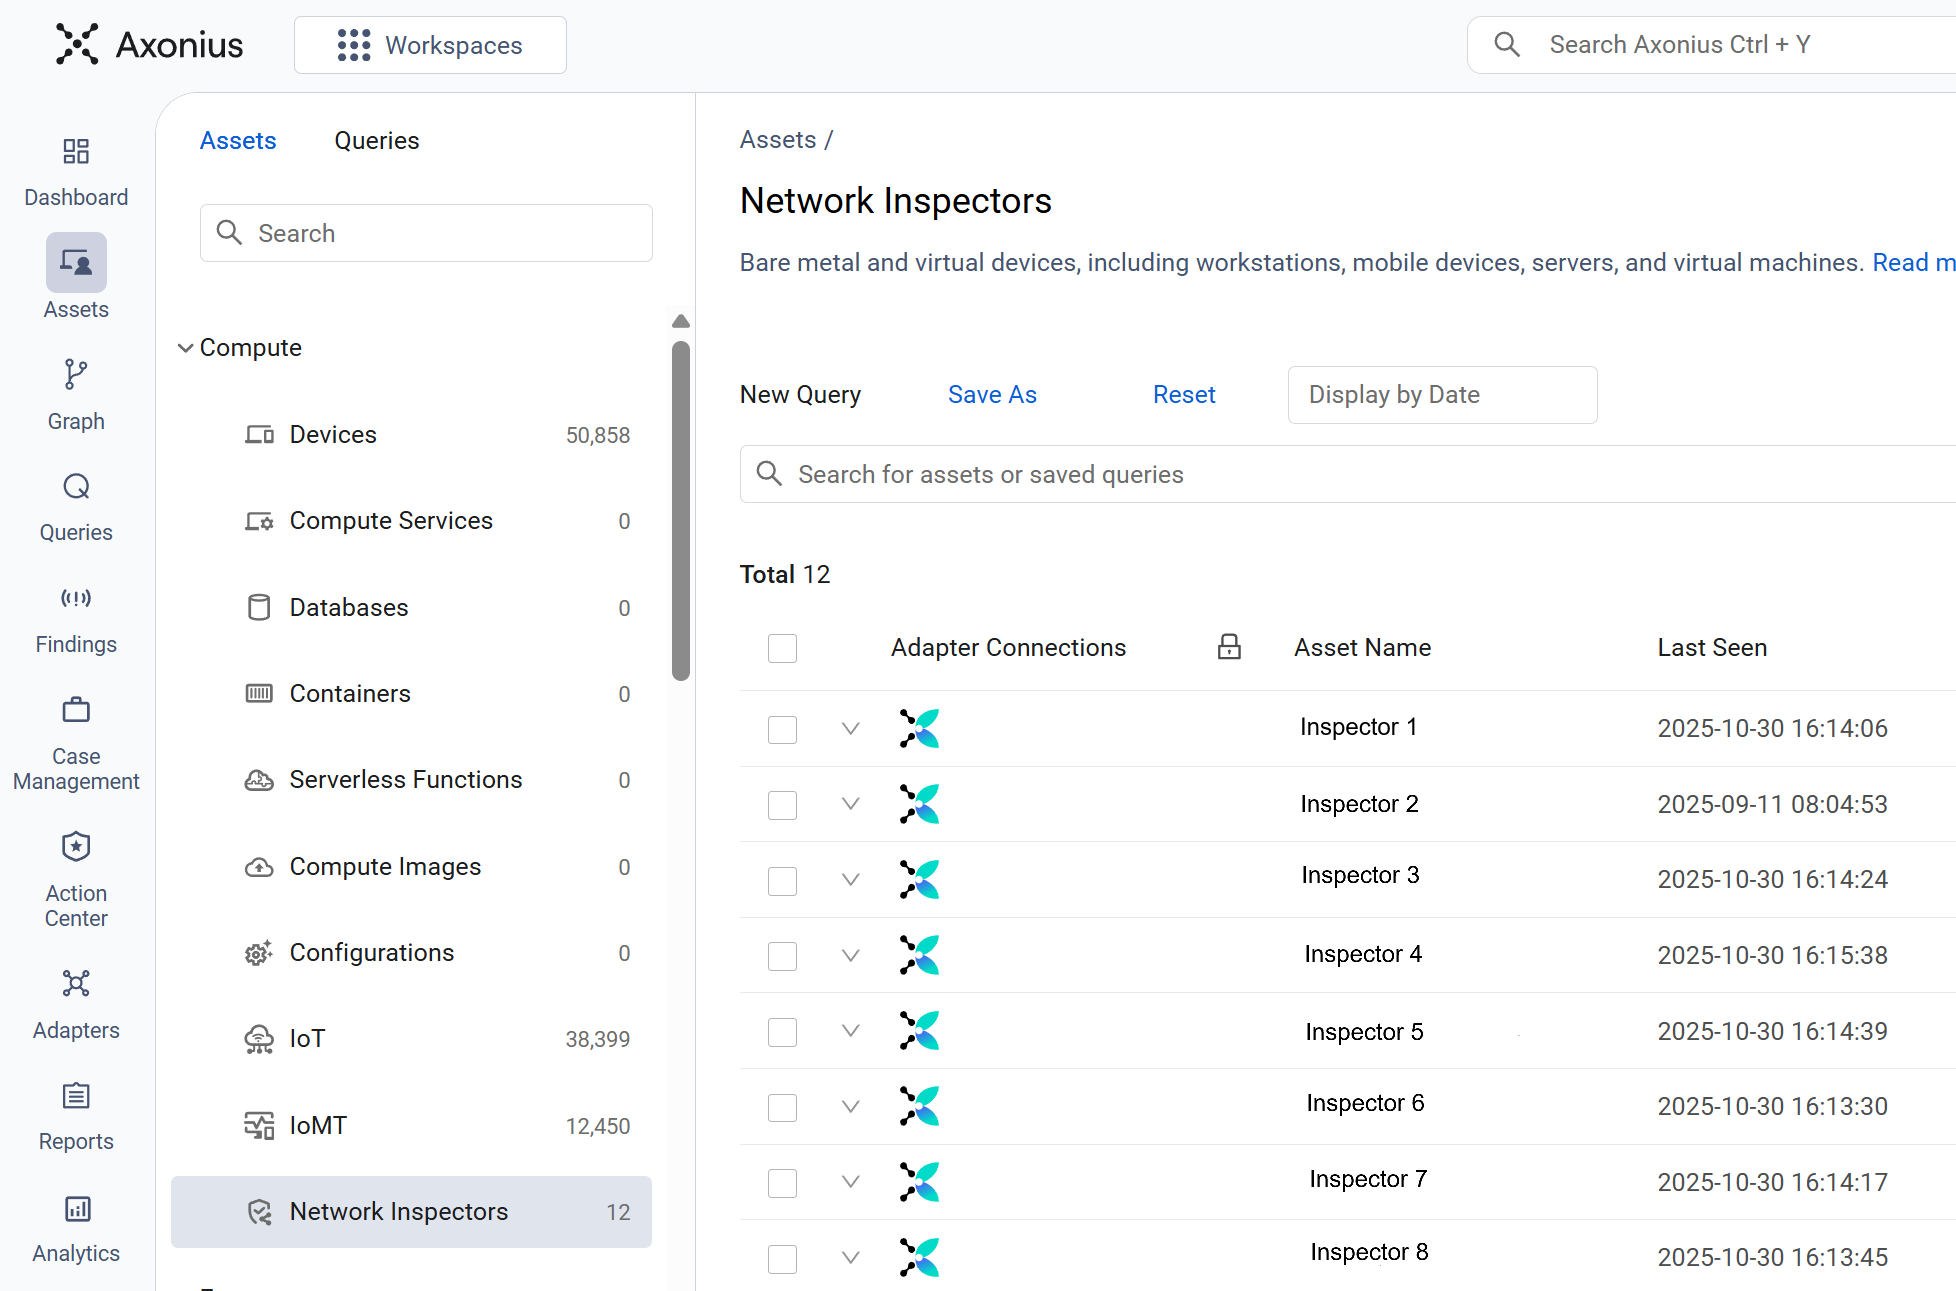
Use the Network Inspectors asset page to view the details of the Network Inspector devices on your network. Click the Assets icon on the left pane, and then select Compute > Network Inspectors.
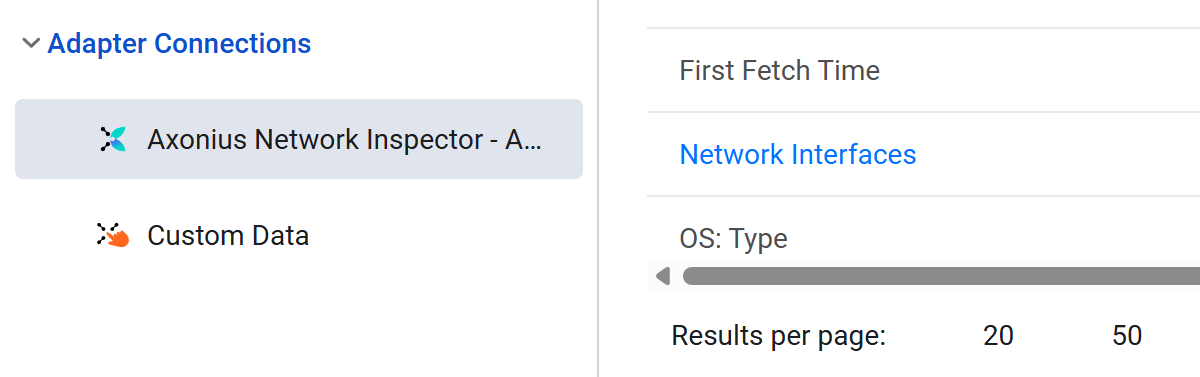
Adapter Connections
The displayed information is collected through the Axonius Network Inspector device and the Axonius Network Inspector adapter.
Network Inspector Devices Table
The Network Inspectors asset page displays a table listing the Network Inspector devices in a default view. Not all of the fields are displayed by default. Use Edit Columns to add or remove columns.
Each user can customize what fields appear in their own, personalized default view. For more information, see Setting Page Columns Displays.
Click the arrow next to any of the fields to see more details about that field.
Network Inspector Device Fields
There are numerous fields that you can view and query on the Network Inspectors asset page. This includes the following most-important fields:
- Status - The current operational state of the device. This indicates its health and reporting status.
- Asset Name - The unique name assigned to the device within the Axonius platform.
- Device Manufacturer Serial - The unique, fixed serial number assigned by the hardware manufacturer for identification.
- Facility Name - The name of the physical site or building where the device is deployed.
- Location - The specific physical placement within the facility (for example: Rack 4, Server Room A).
- Cloud Connectivity - Indicates whether the device is successfully communicating with the Axonius cloud environment.
- Management Version - The version of the central software managing the device.
- Collector Version - The version of the core data collection engine (the Network Inspector software) running on the device.
Adding Custom Fields to Network Inspector Devices
You can add custom fields to one or more Network Inspector devices at the same time. You can use this to add additional details like a description or manually add acc
Select one or more Network Inspector devices and then from the Actions menu choose Add Custom Fields.
Refer to Working with Custom Data to learn about adding custom fields.
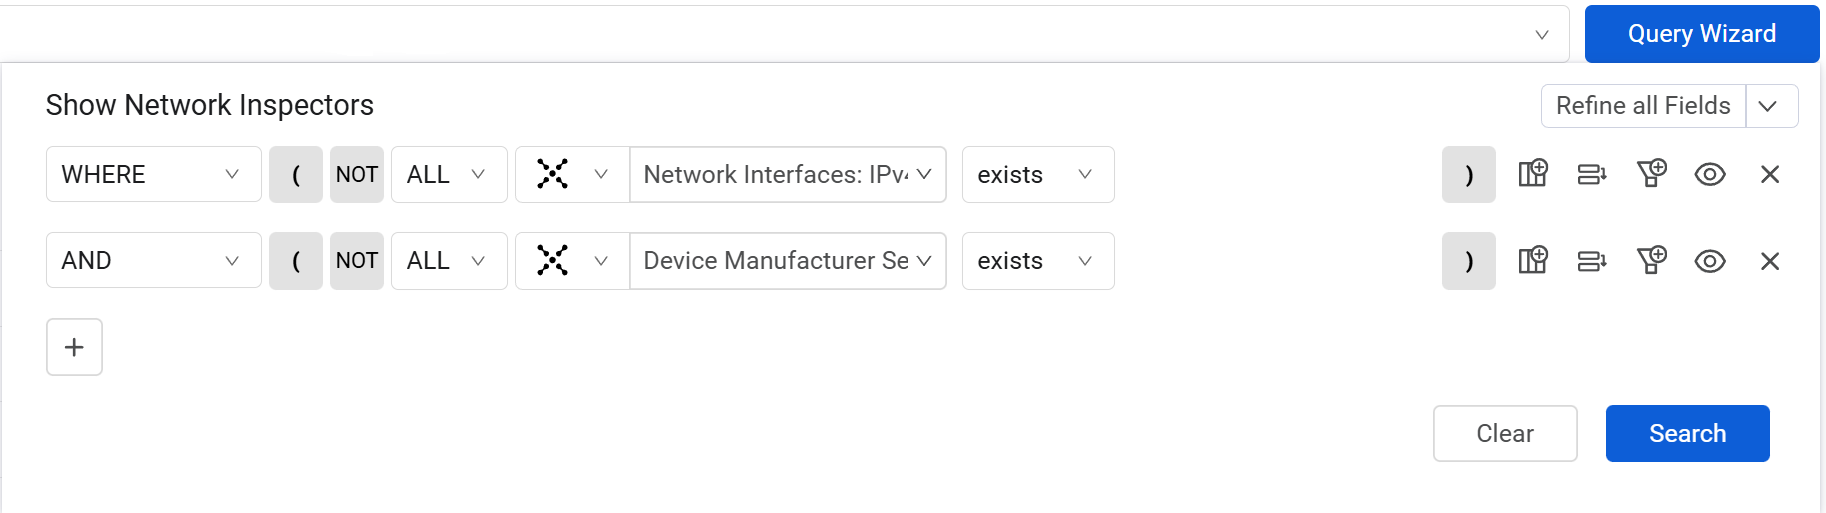
Creating Queries on Network Inspector Devices
You can create queries on this page using the Query Wizard or the Basic Query and query fields. Refer to Creating Queries with the Queries Wizard and how to create Queries in Basic mode to learn more about creating queries.
After running the query, the overview and table show the relevant Expenses, filtered by the criteria you defined in your query.
Add Tags to Network Inspector Devices
Use tags to assign context to your Network Inspector devices for granular filters and queries. Apply new or existing tags to the selected devices. The list of selected tags is applied to all selected applications.
Refer to Working with Tags to learn about adding tags to IoMT devices.
View an Network Inspector Devices Profile
You can click on an individual asset in Network Inspector devices to see all its relevant data. For more information, see Asset Profile Page.
Updated 9 months ago