
Assets Page
Use the Assets page to manage assets discovered in your environment. You can manage different types of resources as assets in your system just like you would any other asset. All your environment's resources are accessible from one place. This provides a new level of granularity for analyzing the attack surface. Using queries, critical assets can be prioritized and workflows can be made more efficient.
To open the Assets page, click the Assets icon on the left navigation panel.
In Axonius New Navigation Experience access All Assets from the Inventory menu.
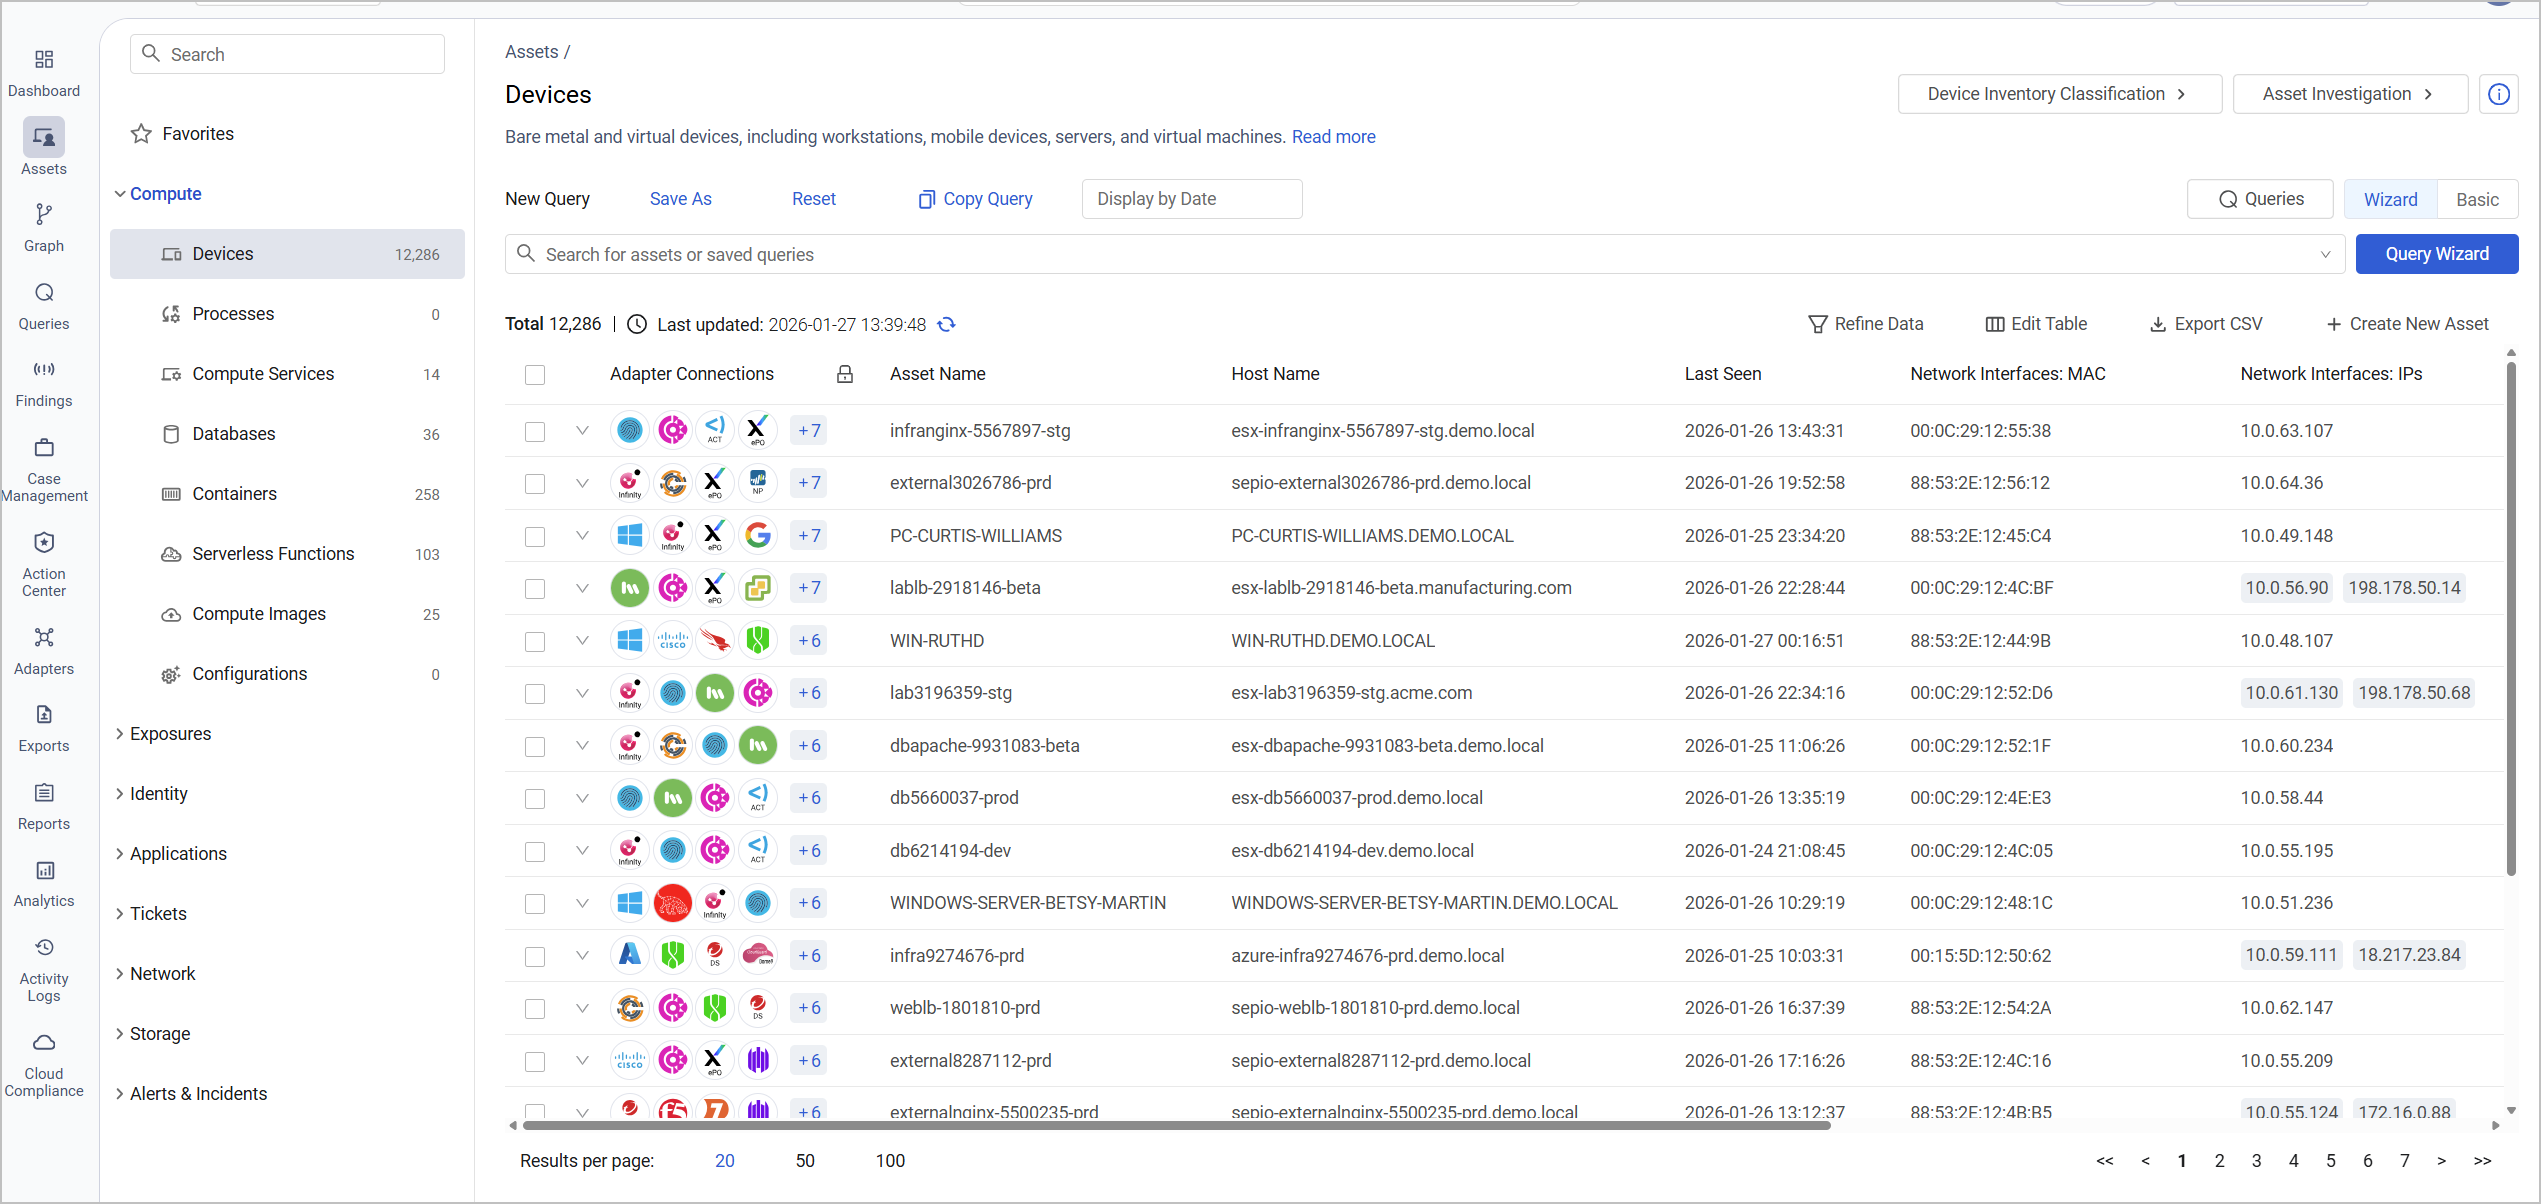
The Assets page consists of an Assets selection menu on the left and a results table on the right.
Selecting a Data View
A Data View determines whether an asset page and its Query Wizard read from:
- Live Data - The most up-to-date data. When a Discovery Cycle is running, this data may change.
- Latest Snapshot - Stable data that isn't affected by an active Discovery Cycle.
- Historical Date - A snapshot taken on an earlier specific date.
Data Views are available on every asset type. See Selecting a Data View.
Viewing Assets by Type
On the Assets selection menu, assets are organized into categories, under which the various asset types are listed. The asset categories can expand and collapse.
The asset categories are:
- Compute - Includes the following assets:
- Devices
- Compute Services
- Databases
- Containers
- Serverless Functions
- Compute Images
- Configurations
- Exposures - Includes the following assets:
- Security Findings
- Aggregated Security Findings
- Identity - Includes the following assets:
- Users
- Groups
- Roles
- Organizational Units
- Accounts/Tenants
- Certificates
- Permissions
- Rules History
- Rules
- Managed Identities
- Job Titles
- Applications - Includes the following assets:
- Software
- SaaS Applications
- Application Settings
- Licenses
- Expenses
- Application Extensions
- Admin Managed Extensions
- User Initiated Extensions
- Application Add-Ons
- Application Extension Instances
- Admin Managed Extension Instances
- User Initiated Extension Instances
- Application Add-On Instances
- Application Keys
- Activities
- Business Applications
- Domains and URLs
- Applications
- Application Services
- Secrets
- Application Resources
- Audits
- Tickets - Includes tickets from applications like ServiceNow.
- Network - Includes the following assets:
- Networks
- Load Balancers
- Network Services
- Network Devices
- Network/Firewall Rules
- Storage - Includes the following assets:
- Object Storage
- File Systems
- Disks
- Alerts & Incidents - Includes the following assets:
- Alerts/Incidents
- Alerts/Findings
Select an asset type to see the inventory of assets in the relevant asset table to the right. The asset table changes to display data for the selected asset type. You can select one or more assets in the table and perform actions from the Actions list. Hover on the row of an individual asset in the results table and click on a space between the columns to view more information in the Asset Profile Page.
Note
Assets cannot be moved from one category to another.
Defining Favorite Asset Types
Mark your most commonly-used or high-priority asset types as Favorites to access them quickly from the Assets menu. Favorite asset types are defined per user and apply when navigating to a specific Workspace as well.
- Hover over an asset type to display a Favorites icon. Click the icon to add this asset type to your Favorites.
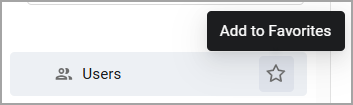
-
The asset type is added under the Favorites category at the top of the Assets list, but it is still listed under its native category as well.
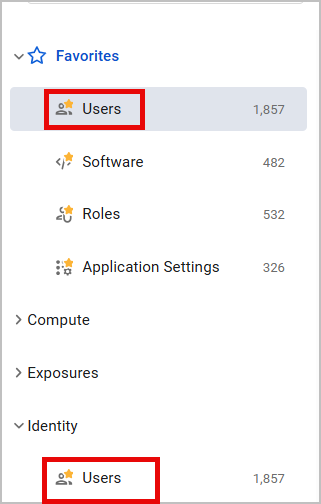
You can add as many asset types to Favorite as you like.
To remove an asset type from Favorites, hover over it and click the Favorites icon again.
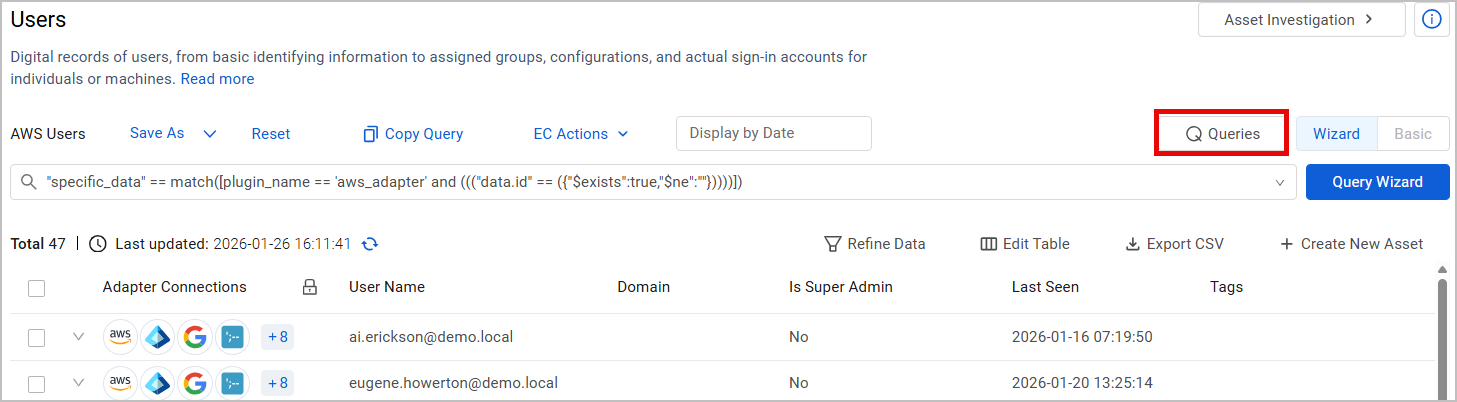
When you define favorite asset types, navigating to the Assets page automatically opens on the top-ranked favorite asset type. For example, here the Users page opened first:
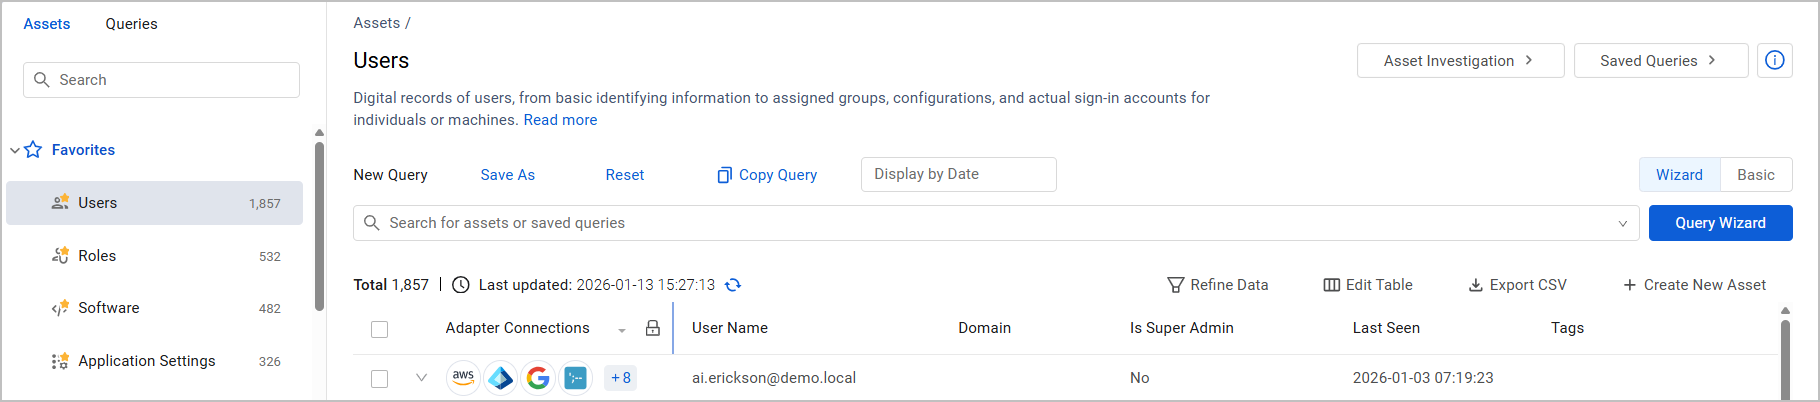
If no favorite asset types are defined, the Assets page opens according to the current default logic - Devices for the global view, and the workspace-specific default asset type for each Workspace.
Viewing Asset Queries
From each Assets page, you can access information about the queries run on this asset type. You can run queries directly from the Assets page and see instant results, and pin frequently used queries for quick access.
To get started, click the Queries button, located above the Assets page's search bar.
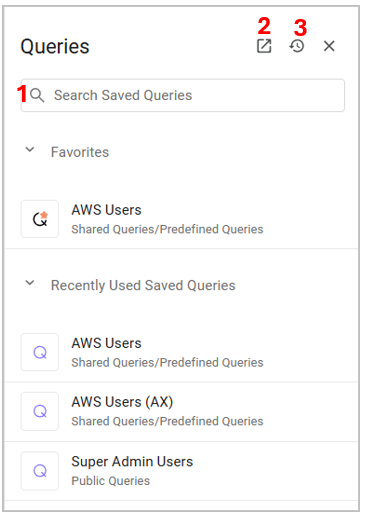
The Queries pane opens on the right. It displays the following categories:
- Favorites - Hover over a saved query to display a Favorites icon. Click the icon to add this saved query to your Favorites so you can quickly access it in the future. To remove the query from your Favorites, hover over it and click the Favorites icon again.
- Recently Used Saved Queries
Use the Queries pane to:
-
Search for saved queries (1).
-
Open the query list in the Queries Page (2).
-
Run Query History (3), which includes both saved and unsaved queries.
-
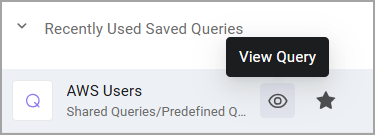
Click a query to instantly run it and display its results in the results table.
-
Hover over a query and click View Query to view its details.
Creating Queries
Use the Query Wizard  to create granular queries to understand how assets adhere to their policies. The Query Wizard presents options appropriate to the selected asset type. You can define a wide variety of filters, from which you can easily drill down to the assets that match the required search criteria. Learn more about Creating Queries with the Query Wizard..
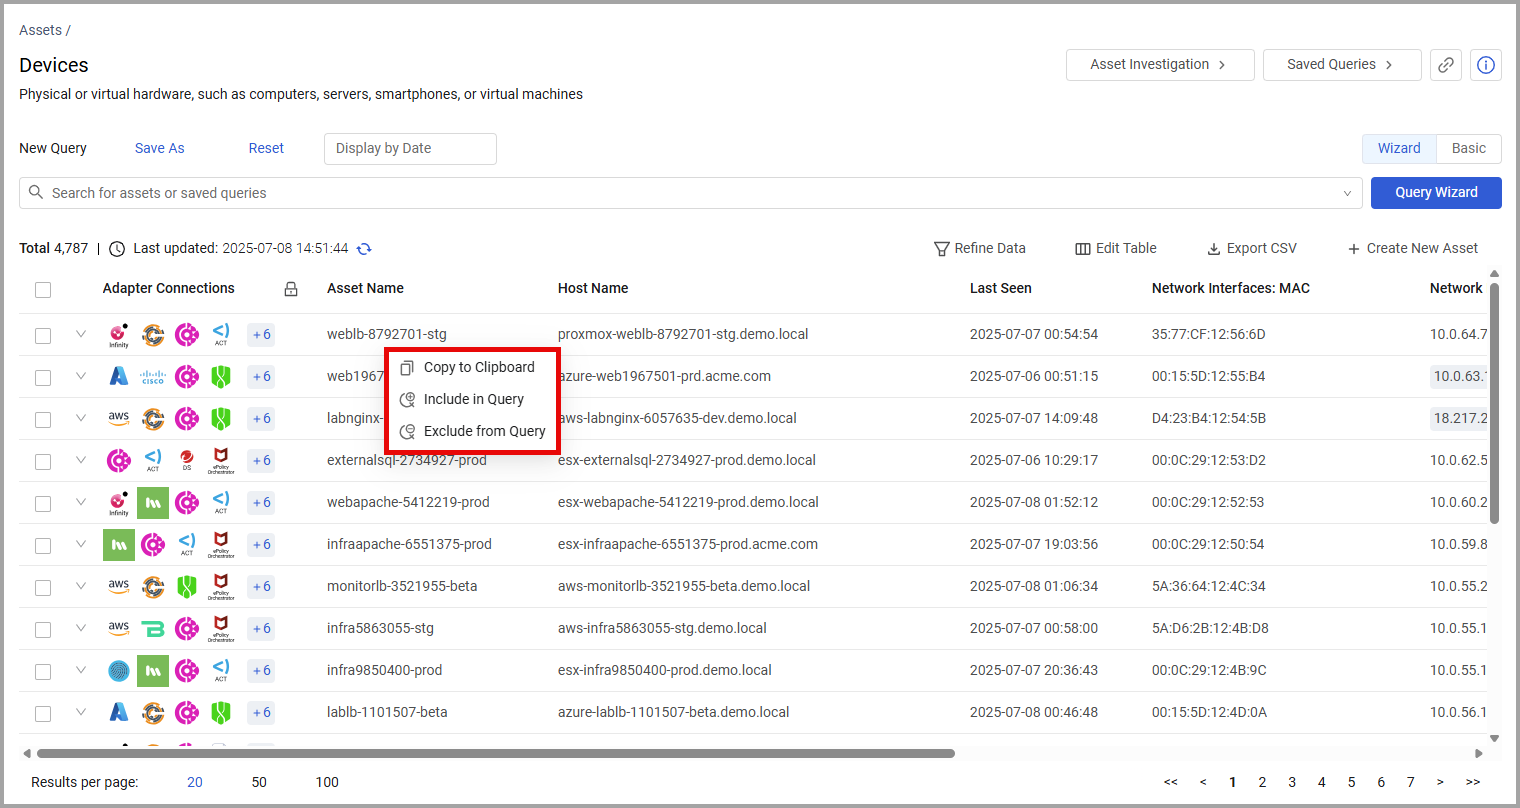
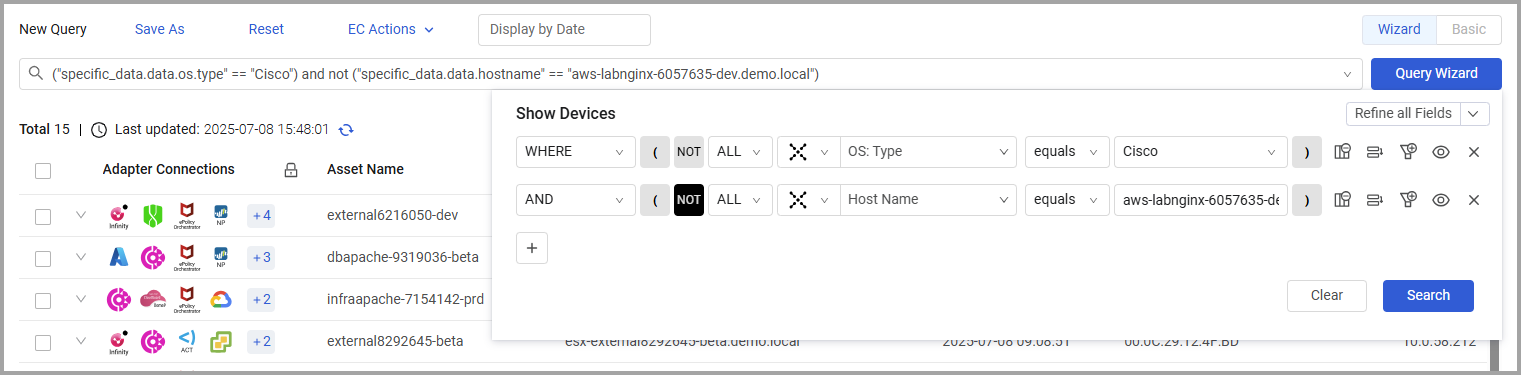
Including/Excluding Values From Assets to the Query Wizard
You can include or exclude a specific value from the Assets table directly to the Query Wizard.
- Select a value in any field (except Adapter Connections) in the Assets table. A menu opens.
- Select Include in Query or Exclude from Query. That value is automatically added to the Query Wizard (with an "AND" operand) and the query is run.
Note
If the existing expressions in the query include an "OR" operand, parentheses are required.
- You can also copy a value from the asset table so it can easily be pasted into the Query Wizard or anywhere else. Note that fields that contain only images (without text) do not support copying.
Any action of Include/Exclude refreshes the query immediately. When you open the Query Wizard, the fields are automatically populated with the selected value. You can use this more than once to add more rows to the Query Wizard.
If you are in Basic mode and use this function, the asset table will refresh and switch to Wizard mode, in addition to updating the Axonius Query Language and Query Wizard.
Viewing Query Results
The total number of assets collected for that query (or for all collected assets when no query is present) is displayed on the top left side of each table:
.png)
A number of columns are displayed for each asset. The asset type determines the columns displayed.
Expanding Asset Data
Click .png) to expand the asset record and to display asset 'uncorrelated' data, i.e., the asset data per adapter. This functionality provides you with a single view and an easy way to identify the source for each of the different field values. Click again to collapse the asset data.
to expand the asset record and to display asset 'uncorrelated' data, i.e., the asset data per adapter. This functionality provides you with a single view and an easy way to identify the source for each of the different field values. Click again to collapse the asset data.
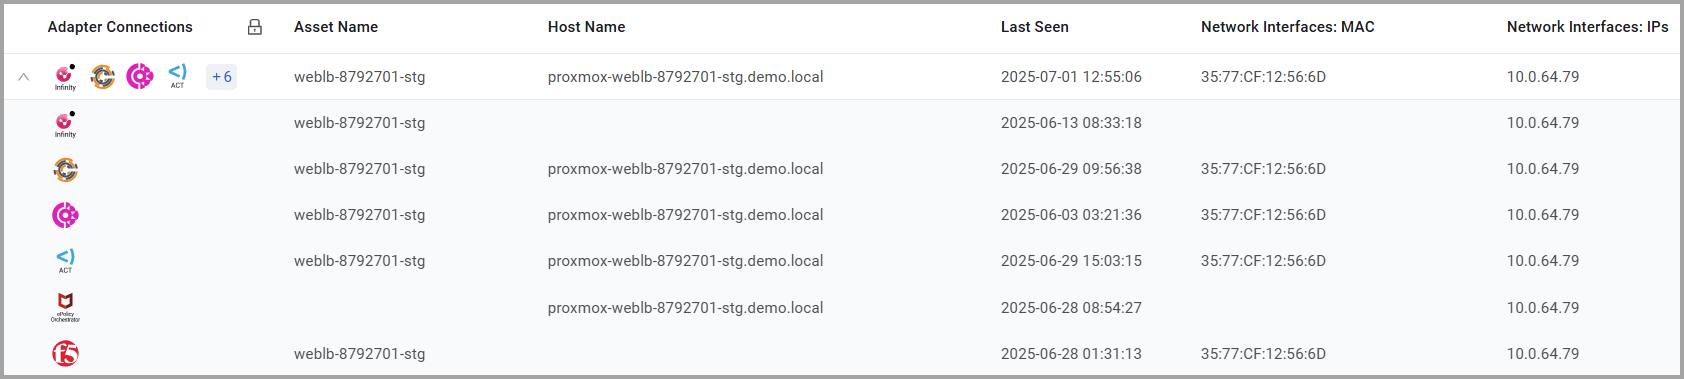
Hover over the Adapter Connections column to see the adapter name for all adapter connections in a tooltip. If you defined an Adapter Connection Label on the adapter connection configuration it will be concatenated to the adapter name value. This can help distinguish between two adapter connections from the same adapter.
Expanding Aggregated Field Data
There are two types of asset columns:
- Aggregated data fields - A common field which contains data fetched from different adapters. For example, Host name, MAC address, OS type, and many more.
- Specific data fields - A unique field which contains data fetched from a single adapter source. For example, "Region" field from Amazon Web Services (AWS).
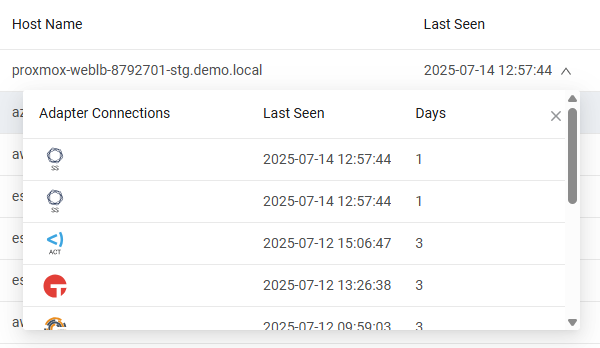
Click the arrow  in any generic data field to view a tooltip with the field's 'uncorrelated' data, that is device specific field data for that asset entity / adapter connection. If the field value's text is long, a dialog appears with the option to copy the text when you hover over it in the table. Click the arrow
  to collapse the tooltip.
For example, if you expand the 'Last Seen' field, you can see when the device was seen by each of its source adapters. Hover over the number of additional parameters to display a context menu showing the first 10 parameters in this field. You can scroll through the data. For fields with multiple values, you can click the copy icon to copy the values to the clipboard.
For list fields click View all results to open the data in the Asset Profile page, presented as a table.
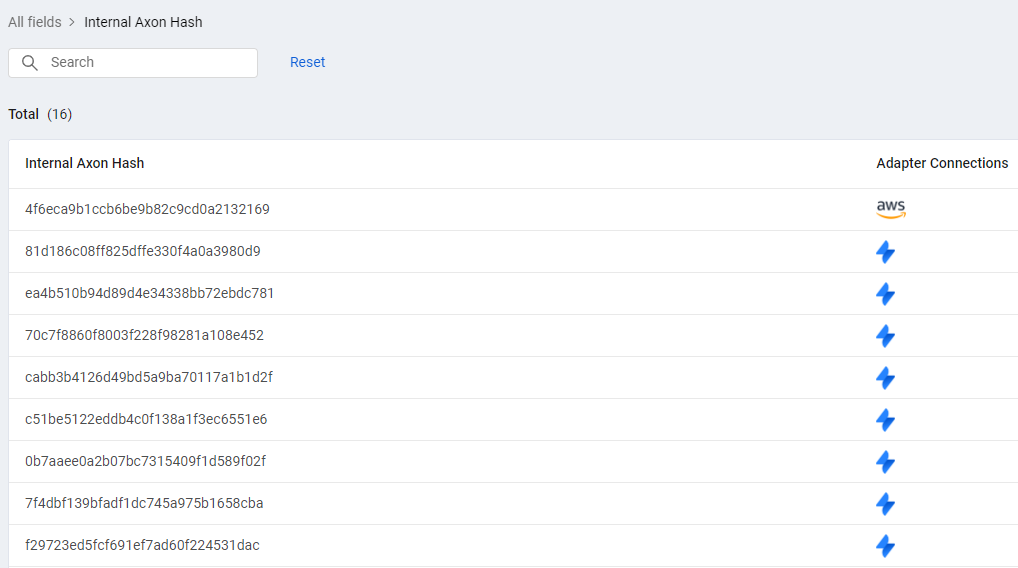
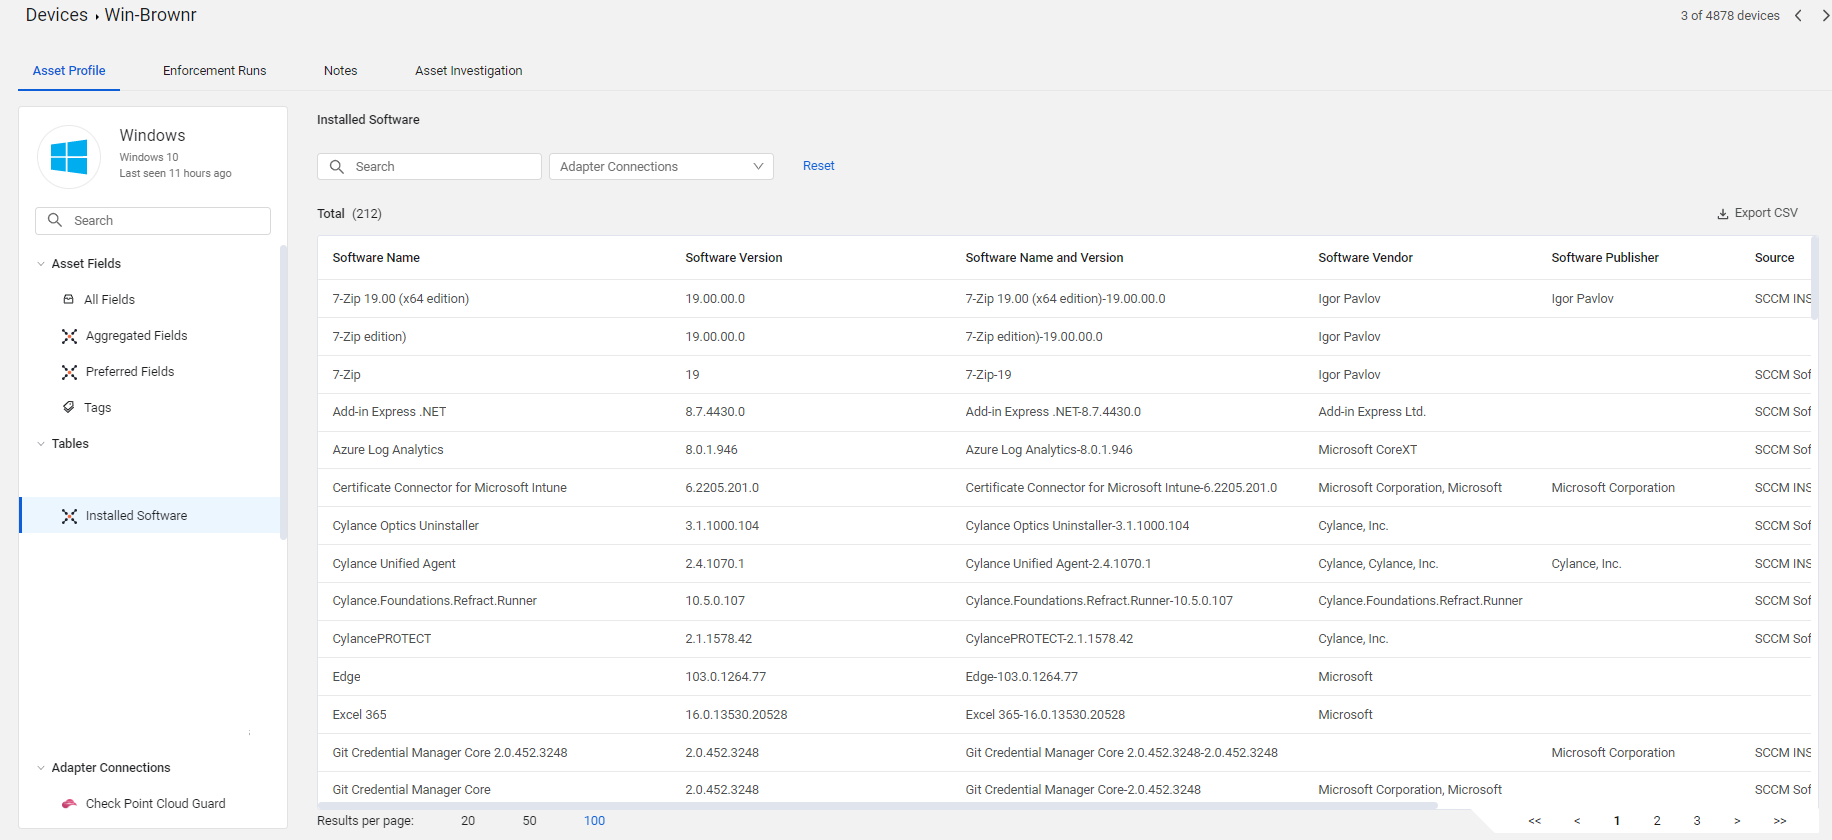
Viewing Complex Fields on the Asset Profile Page
Complex fields are fields which can display a number of parameters. For instance, the Installed Software field can contain the Software Version field, the Software Name field, Software Vendor field and more.
There are two ways to explore complex fields. You can either view them from the Asset Profile page as a table, as explained below; or expand the Assets Page by data from a complex field of your selection and view the list of values displayed in the relevant nested fields. Refer to Expanding Assets by a Complex Field for more information.
In Complex fields, the system displays the first few parameters in the field, and then displays the number of additional parameters.
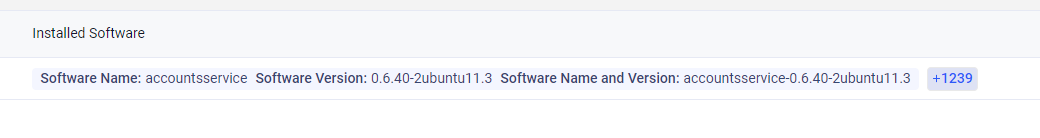
Hover over the number of additional parameters to display a context menu showing the first 10 parameters in this field. You can scroll through the data. 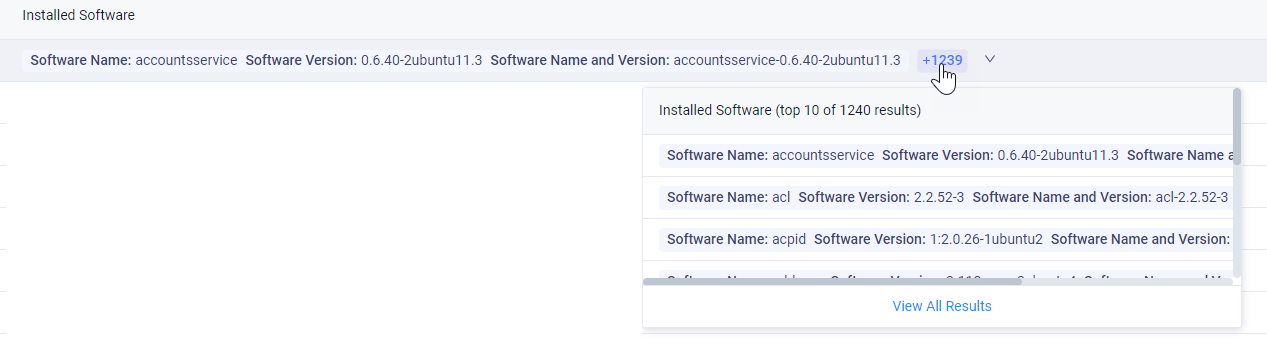
Click View all results to open the data in the Asset Profile page, open at that complex field presented as a table.
Setting Page Columns Display
You can set the columns displayed on the page, and pin specific columns so that they are not scrolled. The Adapter Connections column is pinned by default. Refer to Setting Page Columns Display for more information.
Resizing Columns You can also resize table columns. Columns that contain logos with text fields cannot be resized (for instance OS: Type in Devices or Used By in Applications Extensions). To resize a column, hover over its header and drag the bar that appears to the right of the column to the required column width. Values that are not displayed when the column is narrower, are represented by a numeral.
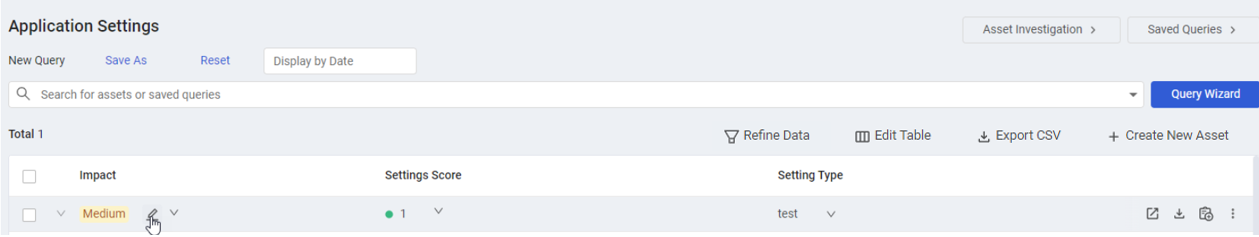
Inline Editing Aggregated Fields
On an Asset page, you can use inline editing to edit values of certain predefined Aggregated fields directly from the Assets table, provided the field has an existing value. After an aggregated field is edited, it is removed and becomes a Custom Field of the same name with the new value.
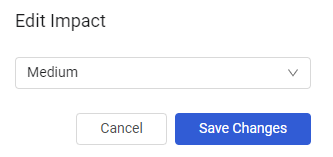
For example, directly from the Application Settings table, you can modify the value of the Impact single select Aggregated field (predefined as inline editable) of an asset from Medium (a value assigned by Axonius to this aggregated field) to High.
- Once you inline edit its value, the Aggregated field and its values are deleted, and a Custom Data field of the same name is created. This field is viewable in the asset's Asset Profile under Custom Data adapter.
- This is unlike Aggregated fields that are not inline editable, where the new value of the field is written to the originating adapter as a new value from a Custom Data adapter, but the aggregated values from the originating adapters remain.
- Predefined Axonius fields, such as Host Name, are not included in the list of inline editable fields. However, you can add value to these fields and other fields not defined as inline editable, using the Add Custom Field action.
To inline edit an Aggregated field value
- In the Assets table, hover over the field value that you want to edit, and click the Edit icon
 that appears (it only appears if the field is defined as inline editable).
 - In the Edit dialog box that appears:
- For a Single Value field: Overwrite the current value with a new value.
- For a Single Select field: From the dropdown, select a new value for the field.
- Click Save Changes. The field value is removed from the table and the new Custom Data field and its value can be seen in the Asset Profile of the asset under Custom Data.
Performing Actions on Assets
Select one or more Assets and use the options in the Actions menu to perform various actions. The available actions change depending on the type of asset. Refer to Asset Actions.
Cancel Query
Cancel Query is displayed when you run a query. Click Cancel Query to revert to the results of the last successful executed query.
Last Updated Indication and Refresh Query
When query caching is enabled and query results are retrieved from cache, the Last updated indication is displayed. This indication specifies the last time the query was executed and from when the displayed query results are updated.
Use Refresh Query to run the query again to recalculate the query results. .png)
Exporting Asset Data to CSV
You can export the query results table data and its view (displayed columns) to a CSV file. Learn about Exporting Asset Data to CSV.
For general information about working with tables, refer to Working with Tables.
Updated 25 days ago