
Hiding the Total Asset Count
This feature is available on the following chart types:
- Field Segmentation - Bars
- Comparison - Bars
- Matrix - Bars
For Asset Data charts and Pivot charts, see Showing or Hiding the Total Calculation.
Some chart types can display data from more than one query. When comparing the same assets, some may be counted more than once, which is reflected in the total numbers. In such cases, you can choose to hide the total asset count to reduce this complexity.
For example, a chart may include data from several queries reporting the same results from an adapter but over different time periods (i.e. last 7 days, last 30 days). If 100 assets were returned in the last 30 days and 25 assets were returned in the last 7 days, the total would show as 125. At least 25 assets would be counted twice. You can hide the total asset count by using the Hide Total calculation option.
For Field Segmentation and Comparison charts:
- When hovering on a bar the percentage is NOT displayed.
- If the change calculation is included, the total change is NOT presented.
NOTES
When the total asset count is hidden in the chart, it is not included in any reports that include that chart.
When comparing current results to a historical date, the selected historical date is displayed below the chart.
To hide the total asset count
- Enter Edit mode of a supported chart type.
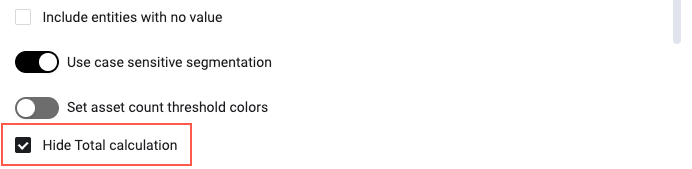
- Scroll down and click Hide Total calculation.
Showing or Hiding the Total Calculation
Use Show total calculation to show or hide the total in the footer of an Asset Data chart or a Pivot chart. For example, hide the full count of servers when you want the chart to show only the rows on the screen.
Permissions: To add a chart, you need the Dashboards > Charts > Add permission. To edit a chart, you need the Dashboards > Charts > Edit permission. You don't need these permissions on your own private dashboard.
To hide the total calculation:
- Open a dashboard.
- Open the chart menu of an Asset Data chart or a Pivot chart, and click Edit.
- Go to the presentation settings.
- Disable Show total calculation.
- Click Save.
The option is available for these charts:
- Asset Data chart, in the Table and Cards views.
- Pivot chart, in the Bar, Pie, and Stacked views.
- Show total calculation is enabled by default. Charts that you saved before the upgrade keep their total.
- For an Asset Data chart, when you disable the option, the footer shows only the number of displayed rows or cards. For example, "Displays 10" appears in place of "Displays 10 out of 4,853".
- For a Pivot chart, when you disable the option, the footer doesn't show "Total X (N items)".
- The option isn't available for the other Pivot views, for example Donut, Line, and Table.
- In the Pivot Bar and Pie views, the option is disabled when Set maximum segments to display is enabled. The footer total is hidden in that case.
- In the Pivot Stacked view, the older Show totals option hides all the totals of the chart, including the footer total. Show total calculation hides only the footer total.
- For an Asset Data chart with Split by complex table enabled, the footer shows other text, and Show total calculation doesn't change it.
- The Query Comparison chart has the same Show total calculation option.
Example: A dashboard shows "Critical servers" as an Asset Data table of 10 rows. The team doesn't want the full count of servers on the screen. Disable Show total calculation. The footer now shows "Displays 10".
Updated 16 days ago