
Query Comparison Chart
The Query Comparison chart is a multiple-query metric that shows the number of results (number of entities) for each selected query.
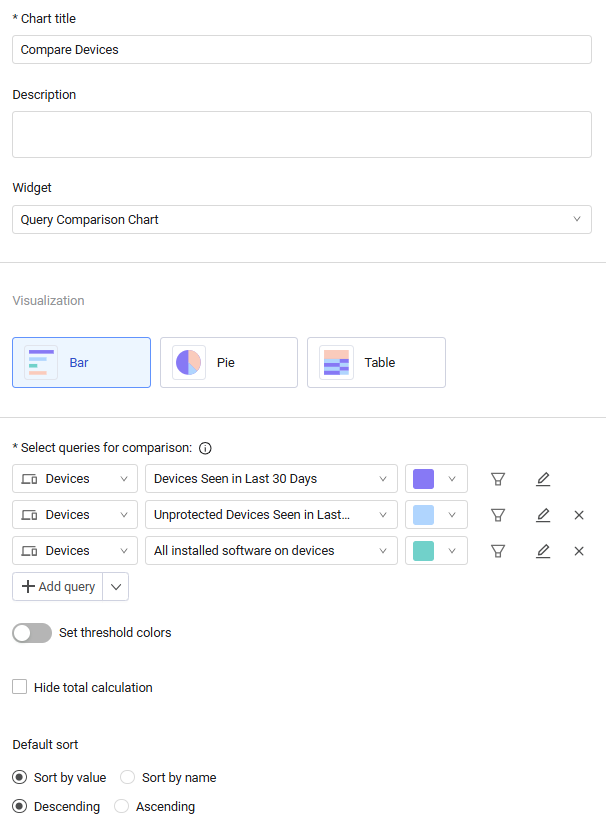
To configure a Query Comparison chart
- You can add a description if you want.
3. From the Widget dropdown, select Query Comparison Chart.
4. Select the chart visualization type: Bar, Pie, or Table.
5. Add queries to compare: - Do one of the following:
- Click Add query to add a query without an asset module selected.
- From the dropdown list, click Add "asset" query and select a query type that includes the asset module. The Add query button lists the name of the asset module selected so that the next time a query is added it will automatically select the same module. To add a query from a different module, select it from the dropdown list.
- Select a query from the Query list or click Add query to create a new query. Learn more about creating a query.
- Add more queries if needed.
- When you choose bar chart or a table, define the default data sort. By default, the data is sorted by descending values. You can choose to sort by name, value, or Query order. You can rearrange the query order by dragging queries to your preferred position. When you rearrange queries, the chart sorting automatically switches to Query order.
As you configure the chart, a preview is created in the left pane. - You can also:
- Assign chart colors to asset count thresholds to easily evaluate the current environment. See Setting Threshold Colors.
- In bar charts, compare today's query results to a previous date. See Comparing Today's Query Results to a Previous Date.
- Set the chart to display results from a relative or fixed historical date. See Viewing Query Results from a Historical Date.
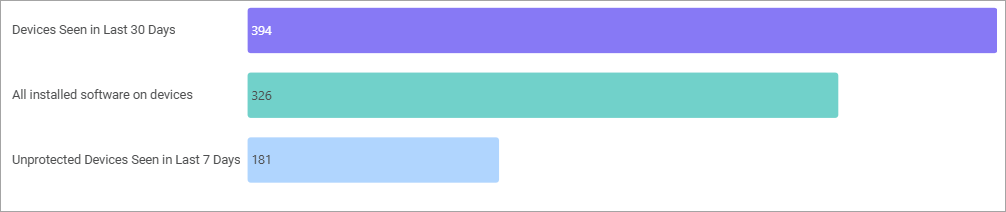
When you create a bar chart, by default, the top 5 results are displayed. Use the pagination button to view the rest of the results.
Bar chart example
Pie chart example
.png)
Updated 6 months ago
Did this page help you?