
Adapter Segmentation Chart
The Adapter Segmentation chart is a single query metric, consisting of a single query. Use this chart to present gaps by showing a segmentation of a number of assets fetched from each adapter, across the dataset given by the query.
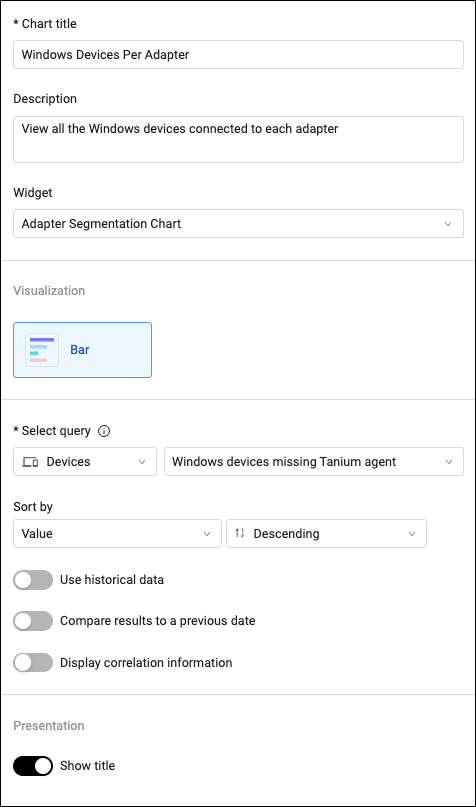
To configure an Adapter Segmentation chart:
- In the Chart title text box, enter a title for the chart.
- In the Description text box, you can add an optional description.
- From the Widget dropdown, select Adapter Segmentation Chart.
- From the Module dropdown, select an asset module.
- Select or create a base query or leave empty for all entities. To learn more see Chart Query Configuration.
- Define the default data sort. By default, the data is sorted by descending values.
As you configure the chart, a preview is created in the left pane. - Select Use historical data if you want to limit the displayed results by a relative date.
- You can also Compare today's query results to a previous date. See Comparing Today's Query Results to a Previous Date.
- Select if you want to display correlation information. This enables creating the Device Discovery and User Discovery system charts in a flexible way.
- In Show title, select if you want to show the title.
-
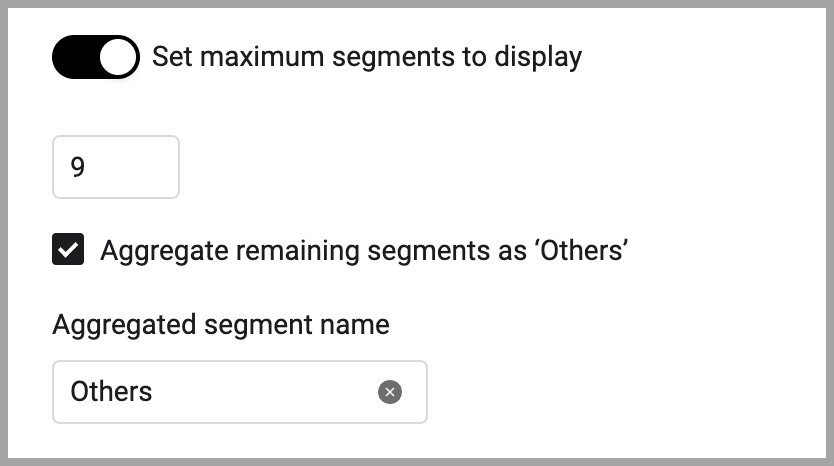
Set maximum segments to display (for bar charts) - Set the maximum number of segment bars to display in the chart. The default minimum is 10. The maximum is 20. When there are more than the set default number of segments, you can aggregate the remaining segments into one by enabling Aggregate remaining segments as ‘Others’. In the Aggregated Segment name field, enter a display name for the aggregation.
- Click Save.
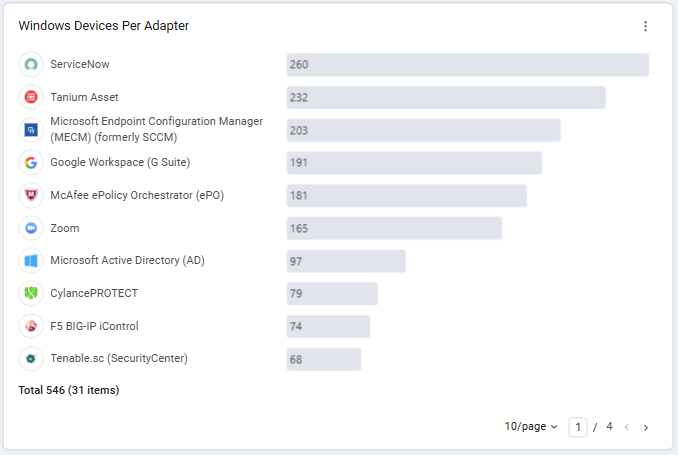
By default, the top 5 results are displayed. Use the paginations button to view the rest of the results.
To export the entire list of results to a CSV file, click the export button.
For example, use adapter segmentation metric to visual gaps by querying for all Windows devices and comparing the number of assets fetched per source.
Updated 8 months ago