
Chart Actions
You can perform the following actions on Axonius dashboard charts:
- Display Chart Tools - Hover over a chart to display the available chart tools.
- Edit - Using the chart action menu.
- Move or Copy - Using the chart action menu.
- Sort - Sort the order of bar chart segments.
- Refresh - Using the chart action menu.
- Pin - Using the chart action menu.
- Copy link - Using the chart action menu.
- Export to CSV - Using the chart action menu.
- Capture Chart - Using the chart action menu.
- Delete - Using the chart action menu.
- Display Historical Data - By hovering over the chart.
- View Results - By clicking on part of the chart.
- Reorder - By hovering over the chart reorder button and use drag-and-drop.
- Pie Chart Legend - By clicking the pie chart legend button.
- Viewing Chart Slice or Section Data - By hovering over parts of the chart.
Permissions:
- Only users with 'Edit Charts' permissions can access the chart menu, move a chart, or resize a chart.
- Only users with 'Delete charts' permissions can delete a chart.
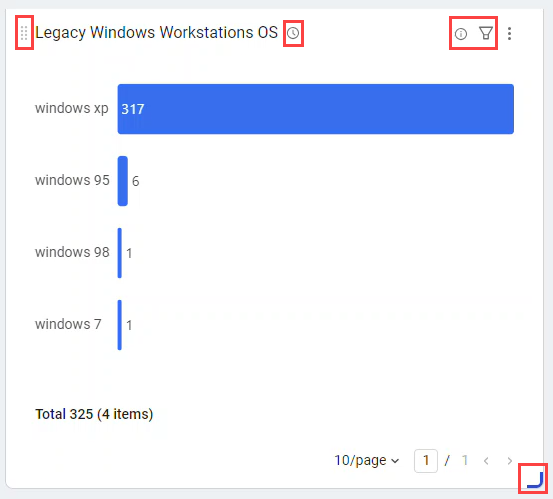
Display Chart Tools
Chart tools appear when hovering over a chart.
For more information on filtering Dashboard charts, see Filtering a Chart.
Edit
Use Edit to edit chart configuration. This action is applicable only to custom charts.
Move or Copy
Use Move or Copy to either copy or move a chart to a different Dashboard. Only custom charts can be moved or copied.
When selected, a Move or Copy dialog opens, which lets you select the Dashboard location to which the chart will be copied or moved.
To move a chart without copying it, deselect Create a copy.
(626).png)
Charts created with a Dashboard template can only be copied. Custom charts added to a Dashboard created from a template can be moved or copied.
If the source dashboard is available to All Data Scopes but the destination Dashboard is accessible only from the Current Data Scope, the chart queries must be updated to ADS first.
To move a chart from a Dashboard with All Data Scope permissions to a Dashboard with Current Data Scope permissions.
Export to CSV
Use Export to CSV to export the chart data to a CSV file or export as an image. The following charts can be exported to CSV:
- Pivot chart
- Field Segmentation charts
- Adapter Segmentation charts
- Query Timeline charts
- Matrix Data charts in table view
To export chart data to CSV:
- Find the chart whose data you want to export.
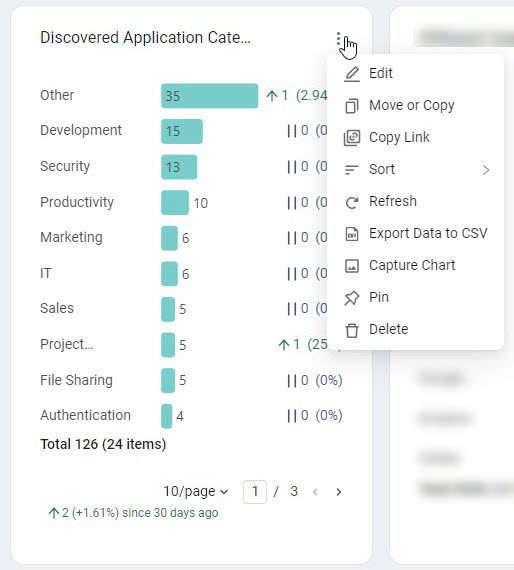
- From the 3-dot more menu, click Export to CSV.
- The data is downloaded to your local device.
Capture Chart
Use Capture Chart to download a .png image of any chart to your device. You can then share the image or include it in a presentation.
Delete
Use Delete to delete a chart and remove it from the current Dashboard. Only custom charts can be deleted.
Any background calculations for this chart should stop running within 24 hours after you delete the chart.
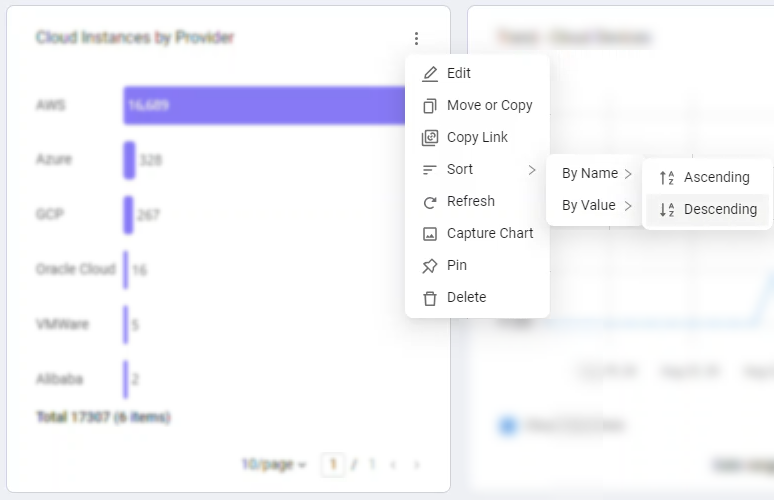
Sort
Use Sort to determine the default sort of data for bar charts. Sort is available for the Field Segmentation and Query Comparison bar charts.
- The available sort options are:
- Sort by Value (Descending/Ascending) - Sorts by the segment size.
- Sort by Name (Descending/Ascending): Sorts by the segment title.
- You can also use the chart menu to change the default sort.
Refresh
Use Refresh to refresh the chart data. Refresh reruns the queries configured in the chart.
Pin
Click Pin to pin a chart to the dashboard. Once a chart is pinned it cannot be moved or resized. This can ensure a consistent order when making other changes in the Dashboard or for fixing important KPIs at the top of the dashboard.
You can unpin a chart by clicking Unpin from the Actions menu.
Copy Link
Click Copy Link to copy a link to the dashboard to your clipboard. This allows you to share the dashboard with other users.
NoteUsers who access the dashboard with this link will only see data according to the access granted by their assigned role permissions.
Display Historical Data
Axonius saves daily “snapshots” of all collected data. You can use this historical data to view any query on the Devices page, on the Users page, or to access Dashboard insights relevant to a specific day in history.
To view Dashboard chart results for a specific date, click the Chart Filters button and then click the Select historical date field.
A date picker control opens, enabling you to select the desired date. By default, the latest date for which data was collected is displayed.
.png)
Notice that only dates with collected data are available.
To clear the historical view and set back to the latest date, click Clear Filters.
View Results
Click a bar, pie slice, matrix field, or other data point on a dashboard chart to view the list of assets it represents.
The following options are available when clicking on a chart segment or link:
- Standard Click: Opens in a new tab and switches focus.
- CTRL+Click: Opens in a new tab, focus stays on the dashboard.
- SHIFT+Click: Opens in a new window.
The Asset page that opens also shows the corresponding query in the Query Wizard. When the dashboard uses a Saved Query, the query wizard expression will show the query name, and the AQL will show the query ID.
Reorder
Hover over the icon on the top of the chart, and use drag-and-drop to reorder the charts in the Dashboard.
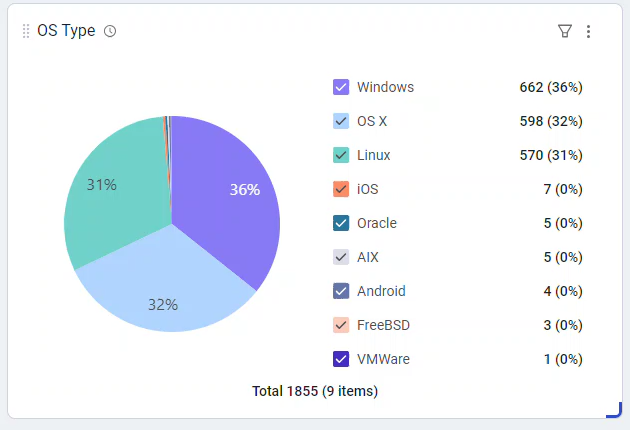
Pie Chart Legend
Resize a chart to display pie chart legend.
- The legend contains data labels for each of the pie chart slices.
- Each data label displays the slice label, number or results and the percentage of the slice size out of the total.
- Data labels are clickable. Clicking a data label will redirect you to the Devices or to the Users page displaying the corresponding list of assets.
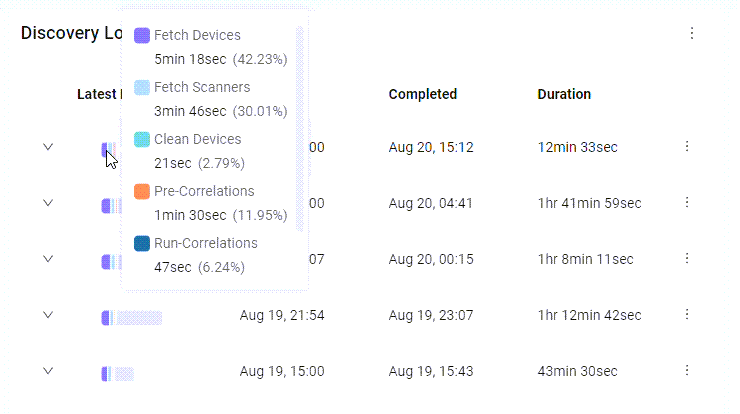
Viewing Chart Slice or Section Data
You can hover over parts of the chart to display a tooltip containing more details about the chart's values.
Updated 14 days ago