
Software
Use Axonius Software Assets to see a consolidated view of all installed software in the organization, from all sources across all devices. The Software page delivers increased management of your organization's software. It helps security, IT, and risk teams identify software assets across fleets of devices.
Click the Assets icon and, from the left pane, select Software.
In Axonius New Navigation Experience from the Inventory menu, select All Assets and from the left-pane, under Applications, select Software.
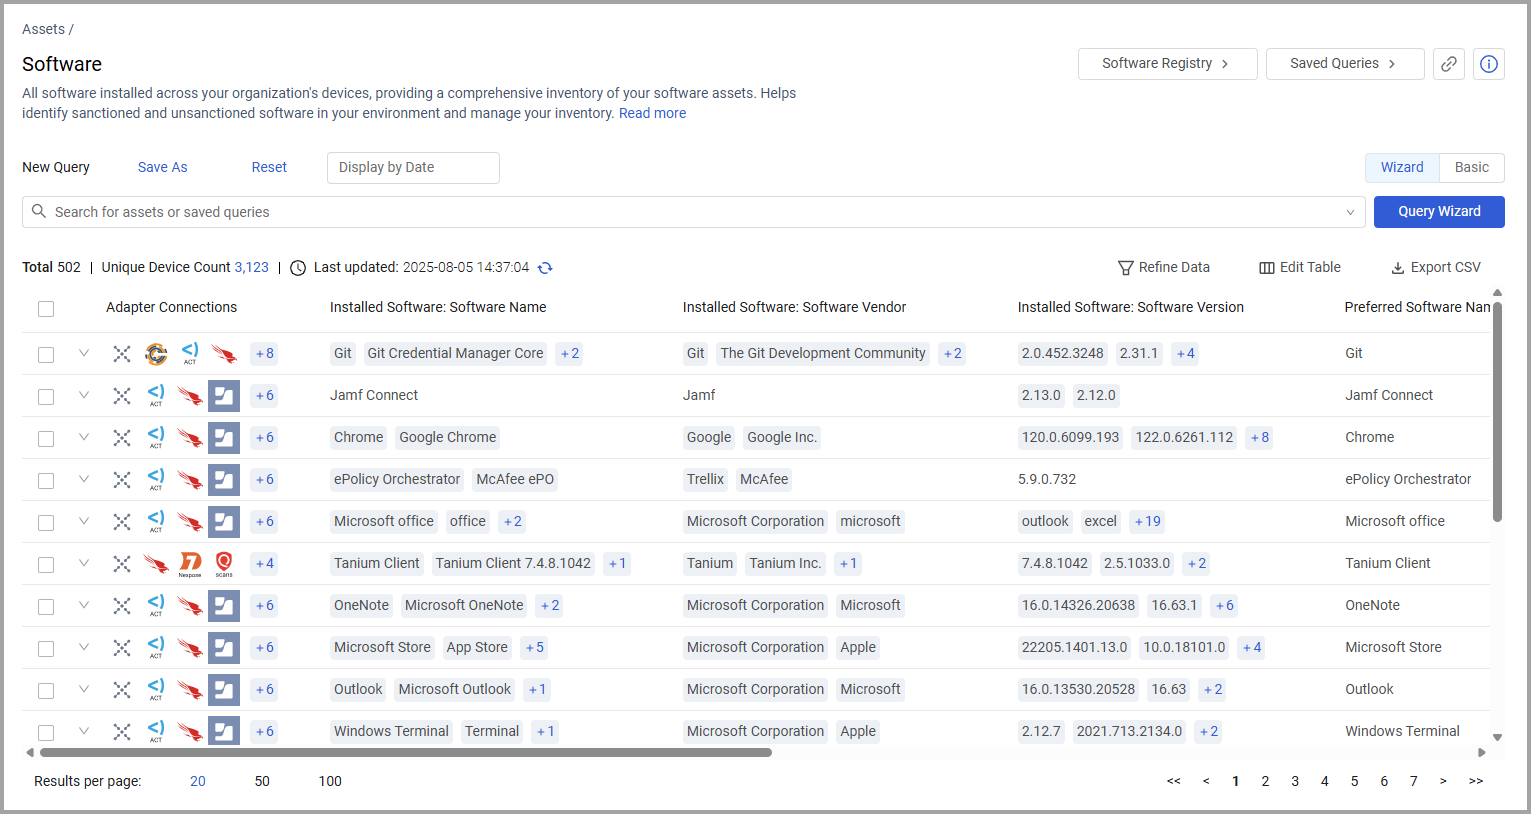
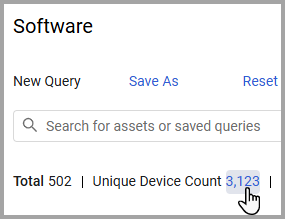
The total number of unique devices on which Software was found is shown above the table. Click on the number of devices to open the devices on which Software was found on the Devices page.
The Software page opens, displaying the following columns:
- Adapter Connections - Displays the adapter source from which the software originates. Hover over the Adapter Connections column to see the adapter names for all the adapter connections. Axonius Catalog enrichment adds information about the name, vendor, and category most commonly used.
- Installed Software: Software Name - Displays the name of the aggregated software data presented by the software name. Click a name of the software to open the Software Profile page that displays software versions and associated devices.
- Installed Software: Software Vendor - Displays the name of the software vendor.
Note
In most cases, the Installed Software: Software Vendor field is interchangeable with Installed Software: Software Publisher due to data parsing inconsistencies among different adapters. However, in some cases, these fields might include different data. To ensure all relevant software data is fetched, you can add the consolidated field Installed Software: Vendor / Publisher to the Software table.
-
Installed Software: Software Version - Displays the software version. Click on the arrow at the top of the column to sort by version.
-
Preferred Software Name - Axonius preferred name for the software, fetched from the Axonius Catalog if it exists there, otherwise, Axonius selects the best naming option from all the fetched names.
-
Preferred Vendor Name - Axonius preferred name for the vendor, fetched from the Axonius Catalog if it exists there, otherwise, Axonius selects the best naming option from all the fetched names.
-
Software Category - Displays a category for the software that is the most suitable category for that software enriched by Axonius Catalog.
-
Device Count - Displays the number of devices in which the software is installed. When you click on Device Count, the Devices page opens with the devices affected by this software.
-
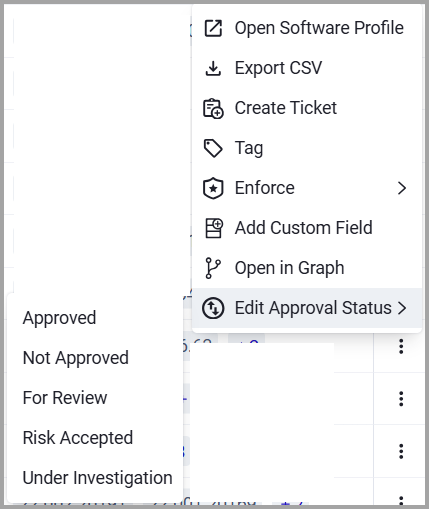
Approval Status - Indicates whether this software is categorized as one of the following (for more information, see Software Registry):
- Approved - The software is authorized for installation and use within the organization.
- Not Approved - The software is prohibited or unauthorized for use within the organization..
- For Review - The software has been identified but is currently waiting for evaluation to determine its compliance or security status. This is often the default state for newly discovered software.
- Risk Accepted - The software has known risks such as vulnerabilities or policy violations, but the organization has granted an exception to allow its use (for example, for critical legacy business functions).
- Under Investigation - The software is being actively analyzed by the security team or other authorized team, typically due to suspicious behavior, unknown origins, or potential security concerns.
-
Tags - Displays one or more user-defined labels for the software. Refer to Working with Tags to learn more about adding tags.
-
First Fetch Time - Displays the timestamp when Axonius first found the software (this column is not displayed by default.)
-
Unique Version Count - Unique Version Count counts the unique number of software versions a given software has (this is because the Installed Software: Software Version field aggregates all software versions of a given software and might sometimes contain duplicate versions). This field can be queried, using <, > and =. Use the Unique Version Count field in software to help identify software with old versions as follows:
- Create a query where version count is greater than the number of versions back that you permit on your system (for instance, 2 versions).
- Then, from the profile pages of these software, you can see the Versions sorted in the versions tab or see the associated devices tab and filter out the last two versions to see all devices that have old versions installed on them. These can then be seen on the devices tab or exported as a CSV file.
-
Inactive License Count: Displays a calculation of inactive licenses by subtracting the installed device count from the licenses entered manually. A negative value means installations exceed licenses. Field is empty if no value was entered in the License Quantity field in the Software Registry.
License Usage Tracking
-
Device Unique Users Count - Shows the number of unique Device users across all devices where the software is installed. This field counts unique values in the "last used users" field for all devices running the software, providing a per-user view instead of the per-installation view.
-
Inactive License Users Count - Shows the difference between your-user based licensed count and the actual number of unique users. This field is calculated as License Count minus Device Unique Users Count, helping you identify unused licenses.
Use the Device Unique Users Count and the Inactive License Users Count to help you compare your licensed software seat counts against actual usage patterns, ensuring your organization optimizes its software spend. For example, if your organization has 500 Microsoft Office licenses but only 350 unique Device’s users on Devices the software is installed on who are actively using the software across all devices, the Inactive License Users Count shows 150, indicating potential cost savings opportunities.
Click the arrow next to any of the fields to see more details about that field.
Not all of the fields are displayed by default. Use Edit Columns to add or remove columns. For more information, see Setting Page Columns Display.
Click on Software Registry to manage software enrichments and maintain a list of approved or unapproved software in your organization, even for software that isn’t installed on any device (software that does not appear in the Software table).
Click on a software item. The Software Profile page opens. The Software Profile page provides detailed information about the Software selected.
Software Versions Saved View
This view is designed to present each software version in a separate row, so each software (each row) in the software table is expanded by its individual versions. This is useful for presenting EOL and EOS data.
Click Edit Table > Saved Views > Software Versions.
The Software page opens, displaying the following columns:
- Installed Software: Software Name
- Installed Software: Software Vendor
- Installed Software: Software Version
- Preferred Software Name
- Preferred Vendor Name
- Software Category
- Device Count
- Approval Status
- Tags
Creating Queries on Software
You can use Queries on the Software page to create a unique set of queries. You can create queries on Software using one of the following modes:
-
Query Wizard (the default) - Create a query using the Query Wizard, or in the query bar, selecting a saved query or writing a query.
-
Basic mode - Create a query by selecting filters. Learn more and how to create Queries in Basic mode.
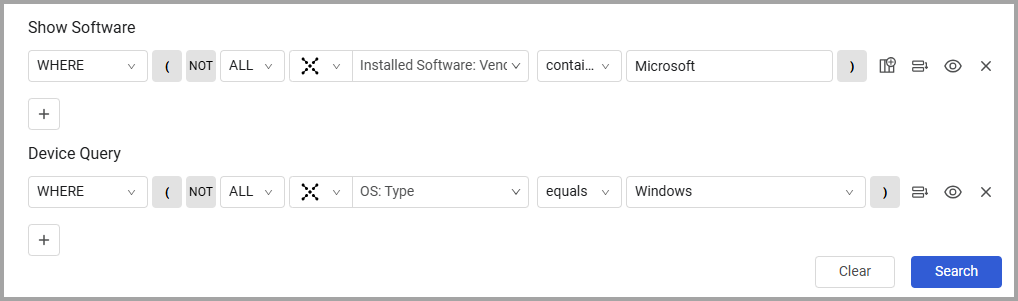
The Query Wizard on the Software page allows you to create a unique set of queries. Software queries are created on two levels. The first level of the query focuses on software parameters. You can query fields such as the software version, adapter connections, or device counts. You can add additional levels to the query, such as querying by network interface and security finding instances. Use these queries to find out which software exists with asset context in your environment or to find out how many devices have a particular software.
To configure the Query Wizard on the Software page
- Build a query on the Show Software field on the table, for instance, Installed Software: Software Vendor.
- Filter the software displayed by a Device query, and thus only show the applications in your environment by a defined Device query, for instance, by OS:Type.
After running the query, the table shows the software queried, filtered by the devices they affect.
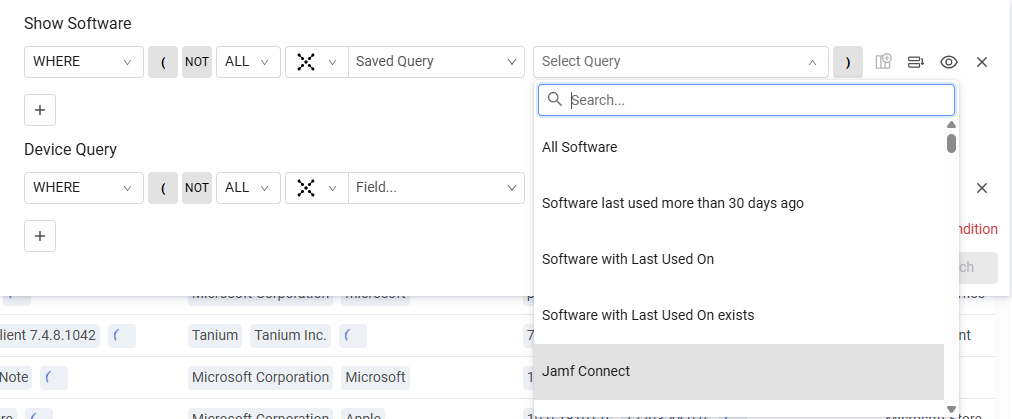
Creating a Query using a Saved Query
You can choose a saved query to use as part of a query. Note the following:
-
You can only use queries that do not use the device level of the query.
-
If a saved query is used in a Software Query (chosen as a saved query), then the system does not allow you to add a device level in that query.
Saving Queries
- Click Save As to save the query.
- When you click Saved Queries and open the Queries page, the software queries you created are displayed on the Queries page.
Refer to Creating Queries with the Queries Wizard to learn more about creating queries.
Last Updated Indication and Refresh Query
When query caching is enabled, and query results are retrieved from the cache, the Last updated indication is displayed. This indication specifies the last time the query was performed and from when the displayed query results were updated.
Click  (Refresh Query) to run the query again to recalculate the query results.
Export Software Data to CSV
You can export the Software data to CSV. Refer to Exporting Asset Data to CSV.
Adding Custom Data to Software
You can add custom fields to one or more Software assets at the same time.
To add Custom fields to one asset click the Actions button at the right side of the row and choose Add Custom Field.
To add Custom fields to multiple Software assets select select one or more Software assets and, from the More Actions menu, choose Add Custom Field.
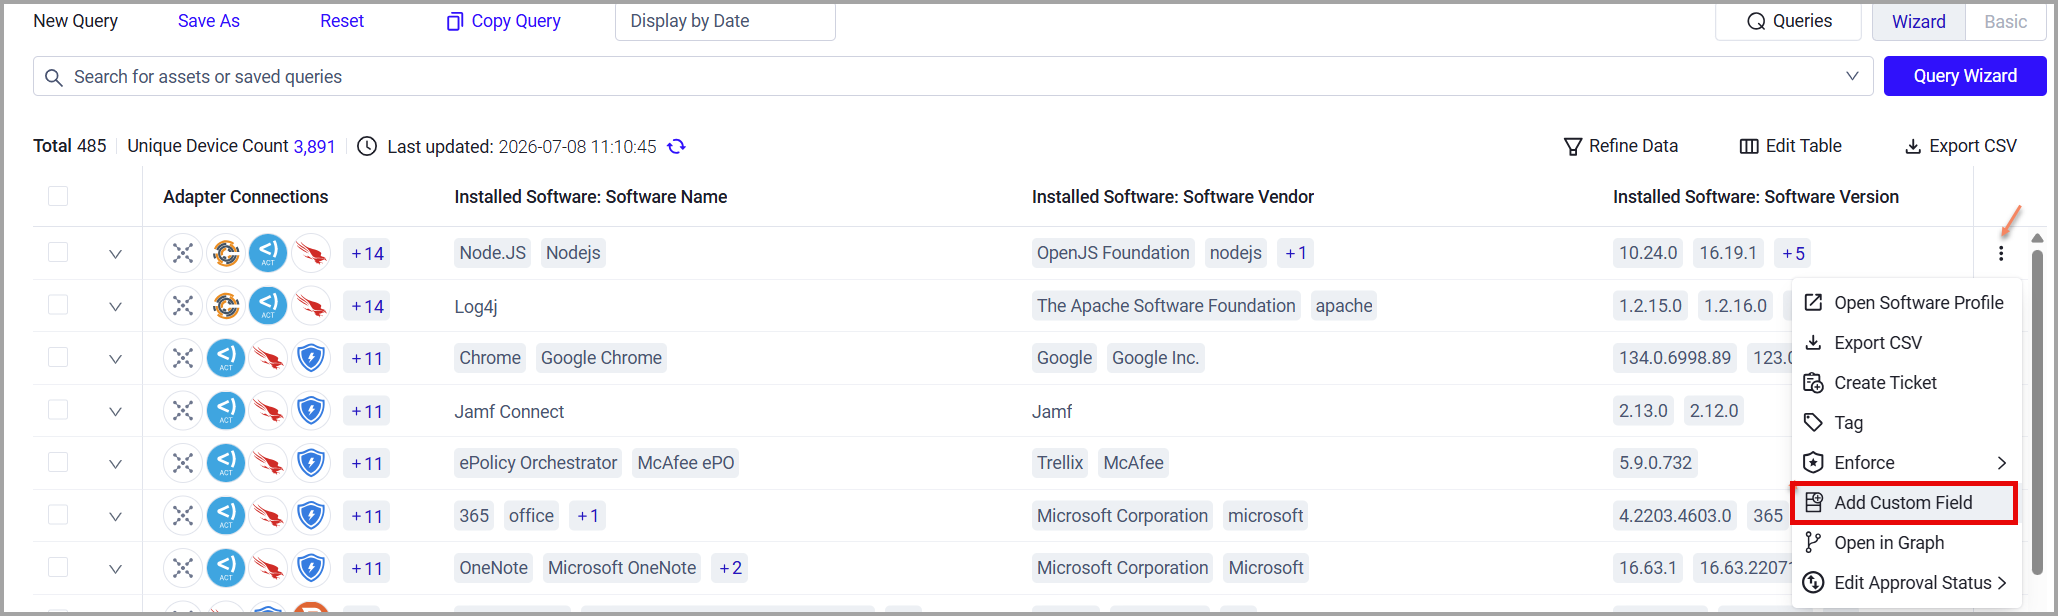
Refer to Working with Custom Data to learn about adding custom fields.
Add Tags to Software
Use tags to assign context to your assets for granular filters and queries. Apply new or existing tags to the selected software. The list of selected tags is applied to all selected software.
Refer to Working with Tags to learn about adding Tags to Software.
Software Registry (formerly Software Approval List)
Click Software Registry to maintain and manage a list of approved and unapproved software, whether installed on devices or not.
You can also edit the Approval Status directly from the Software page.
To edit an Approval Status click the Actions button at the right side of the row and choose Edit Approval Status.
To edit more than one Approval Status, select one or more Software Assets and from the More Actions button at the top of the table choose Edit Approval Status.
Then set it to the status you want.
Using Software Queries in Enforcement Actions
Queries created for Axonius Software Assets can be used as queries in the following Enforcement Actions:
- Axonius - Push System Notification
- Axonius - Send Email
- Email - Send per Asset
- Axonius - Add Custom Data to Assets
- Axonius - Calculate Risk Score
- Axonius - Remove Custom Data from Assets
- Axonius - Add Tag
- Axonius - Remove Tag
- BeyondTrust BeyondInsight - Send Block Policy to SCP
- BeyondTrust BeyondInsight - Send Block Policy to S3
- Manage Custom Enrichment - Enrich assets with CSV file
- Cherwell - Create Incident
- Cherwell - Create Incident per Asset
- ConnectWise Automate - Deploy Patches
- Freshservice - Create Ticket
- Freshservice - Create Ticket per Asset
- Jira - Create Issue
- Jira - Create Issue per Asset
- Jira Service Management - Create Issue
- Jira Service Management - Create Issue per Asset
- Jira Service Management - Create Ticket
- Jira Service Management - Create Ticket per Asset
- Jira Service Management - Update Tickets
- ServiceNow - Create Incident
- ServiceNow - Create Incident per Asset
Enforce - Create New Enforcement
You can create a new Enforcement Actions directly from the Software page with a Main Action that will run on the entities you selected. For more details refer to Enforce - Create Enforcement.
For general information about working with tables, refer to Working with Tables.
Updated 20 days ago