
Getting to Know the Axonius Interface
New Navigation Experience
A redesigned grouped navigation is available from version 9.0. If you have enabled it, see New Navigation Experience for a full guide to the new structure.
The first time you log onto Axonius, the system opens on the Dashboard page. The Axonius Platform side menu is visible from every page and provides your main navigation tool between the modules.
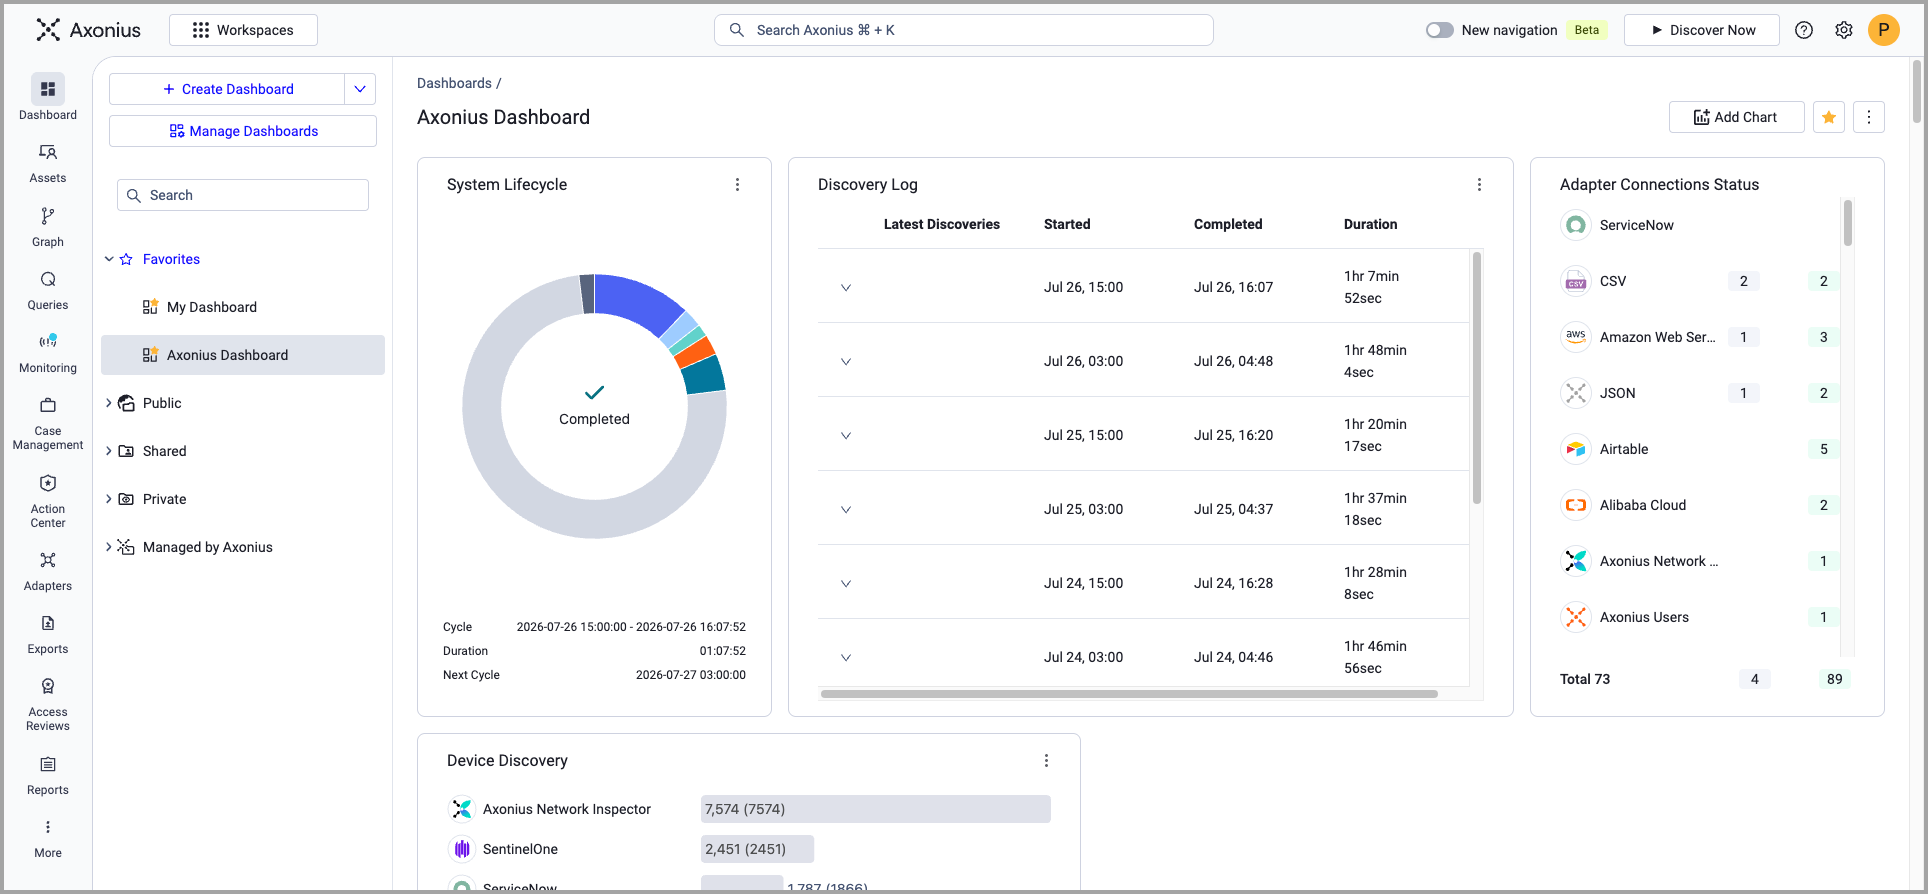
The side menu contains icons to open all of the system modules and pages. All icons may not be displayed. Click the More icon to see the rest of the icons. Right click any icon to open a browser context menu with the option to open the page in a new tab or a new window. You can open the following system elements from the side menu.
Note:In the Axonius New Navigation Experience, the side menu no longer uses a More icon. All items are organized into expandable groups — hover over a group to reveal its pages.
 | Dashboard | The Dashboard provides a single, consolidated, and central area to monitor and absorb insights on all assets based on saved queries designed to shed light on desired policy, breach of policy, and any other questions regarding asset management. The Dashboard page opens by default every time you log in to Axonius. |
 | Assets | Use the Assets page to manage all assets discovered in your environment from one place. |
 | Asset Graph | Use the Asset Graph page to view a visual representation of the connections between the assets in your inventory. |
 | Queries | Use the Queries page to manage the queries on your system. You can see a centralized summary of information about all saved queries in the system. |
 | Monitoring | Use Monitoring to view all alerts created in Axonius, all rules defined in Axonius, and to create new rules. When the first new alert appears on the Monitoring page since the page was last visited, a blue notification dot appears on the Monitoring icon in the side menu. It is removed once you open the Monitoring page. |
 | Case Management | Use the Case Management page to resolve issues of certain types in Axonius, instead of opening a ticket in a third-party system. In the Axonius New Navigation Experience, Cases and Case Sets are accessed directly from the Action Center group. |
 | Action Center | Use the Action Center to automate security and streamline your IT operations. You can use it to create: Configurable Enforcement Sets that execute a saved query and then automatically perform an action on the entities that result from the query (policy gaps) to bridge, mitigate, notify, or create incidents on the identified gaps. Automated Workflows - Handle routine security and IT procedures with automated, multi-step Workflows by chaining events, conditions, and actions to handle routine procedures and automate your security and IT operations. |
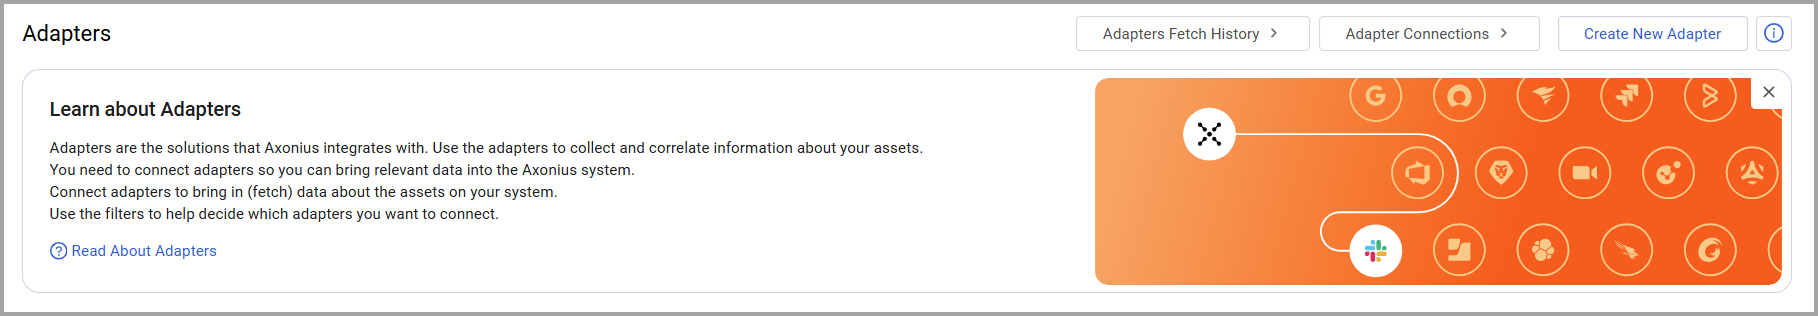
 | Adapters | The Adapters page displays the list of solutions that Axonius integrates with, called adapters. |
 | Reports | Use Axonius Reports to generate a predefined executive report in PDF format, as CSV files, or as both. |
 | Data Analytics | Use Data Analytics to load query data into a configurable pivot table within Axonius. |
 | Activity Logs | The Activity Logs page tracks all activity in the Axonius system. In the Axonius New Navigation Experience, Activity Log is accessed from the System group in the side menu. |
 | Cloud Asset Compliance Center | The Cloud Asset Compliance add-on uses cloud configuration and asset data from cloud IAAS providers and compares those implementations against industry benchmarks and frameworks. |
 | Manage Nodes | The Manage Nodes page displays all the Nodes in your system, and is used to manage the Node(s). In the Axonius New Navigation Experience, Nodes is accessed from the System group in the side menu. |
User Settings
An avatar icon is displayed at the top of the screen. Hover over it to see the User Name and email of the user currently logged on to the system.

Click the avatar to open a menu.
- Use User Settings to view and update the Account Settings and to get the API Key.
- Use Connect As to connect to a different Data Scope.
- Use Theme to set the Theme (dark/light).
- Click Logout to log out of the system.
Top Pane Icons

The following icons appear on the Top Pane:
 | Search pane | Click the Search pane to search for specific assets on the system from any page. Refer to Searching for Assets. |
 | Discover Now button | Manually runs a new global discovery cycle. |
 | Help and Support icon | Clicking this icon opens the following links in a new window:
|
 | System Settings icon | Opens the System Settings. Right click to open a browser context menu with the option to open the page in a new tab or a new window. |
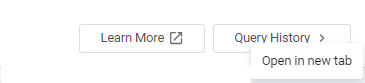
Open Page from Link Button in New Tab
Right click any link button at the top of any page to open the linked page in a new tab.
Collapsible Descriptive Panel
Some pages across the Axonius platform contain collapsible descriptive panels, which clarify the page’s purpose and usage. When present, these panels are expanded by default. To collapse the panel, click the x in the top right corner of the graphic (If there is only a description without graphics, collapse the panel by clicking the  icon.
icon.
Printing Pages
You can use your browser's Print function to print an Axonius screen. It will print the complete screen, including areas that require vertical scrolling, such as drawers and long configuration pages.
Updated 8 days ago