
Using the Role Mining Simulator
Role Mining is an advanced capability that utilizes an AI/ML engine to analyze your organization's existing identity and access data. It intelligently identifies common access patterns and groupings among users based on their current entitlements, group memberships, and application usage. This process helps to discover natural, logical "roles" that reflect actual job functions and responsibilities within your enterprise.
In addition it helps identify outliers by pinpointing individuals whose access patterns deviate significantly from their peer group or proposed role, highlighting potential security risks or policy violations.
You can also create Profiles from the role graph.
To open the Role Mining Simulator:
-
Click Profiles on the left navigation bar to go to the Profiles page.
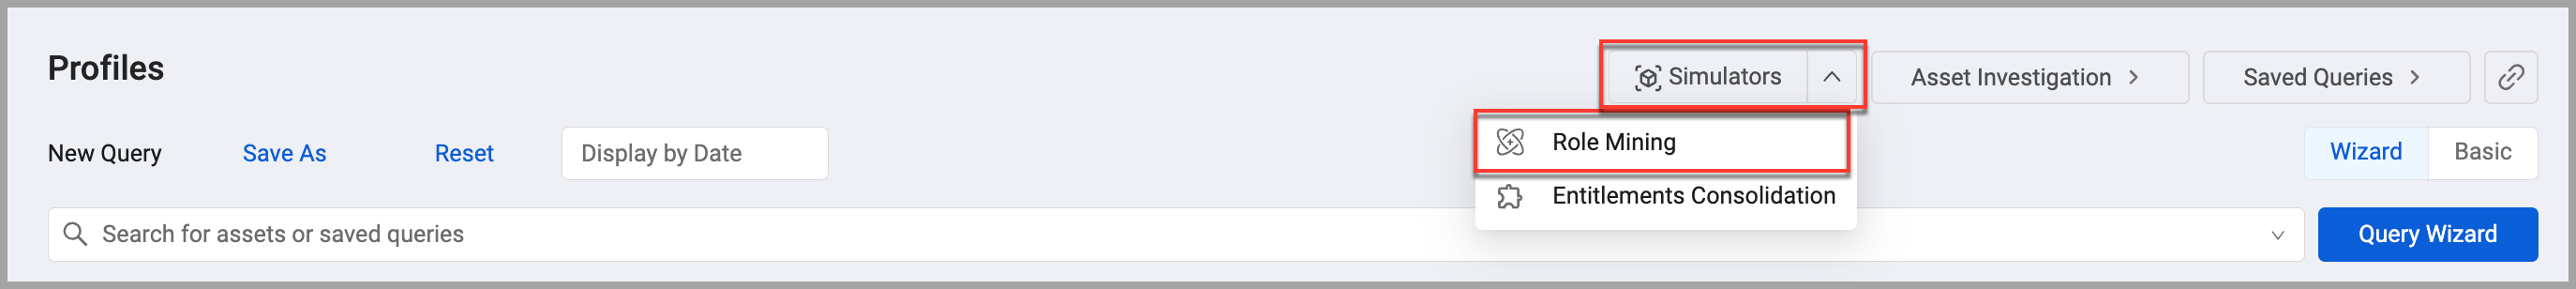
-
From the Simulators list, select Role Mining. The Role Mining simulator opens with the Base Scope applied. See Working with Scopes to learn about creating and managing scopes.
Note
You may see the following message:
To speed graph loading when a large amount of data is present, a preview may be displayed while the full data set is loaded.

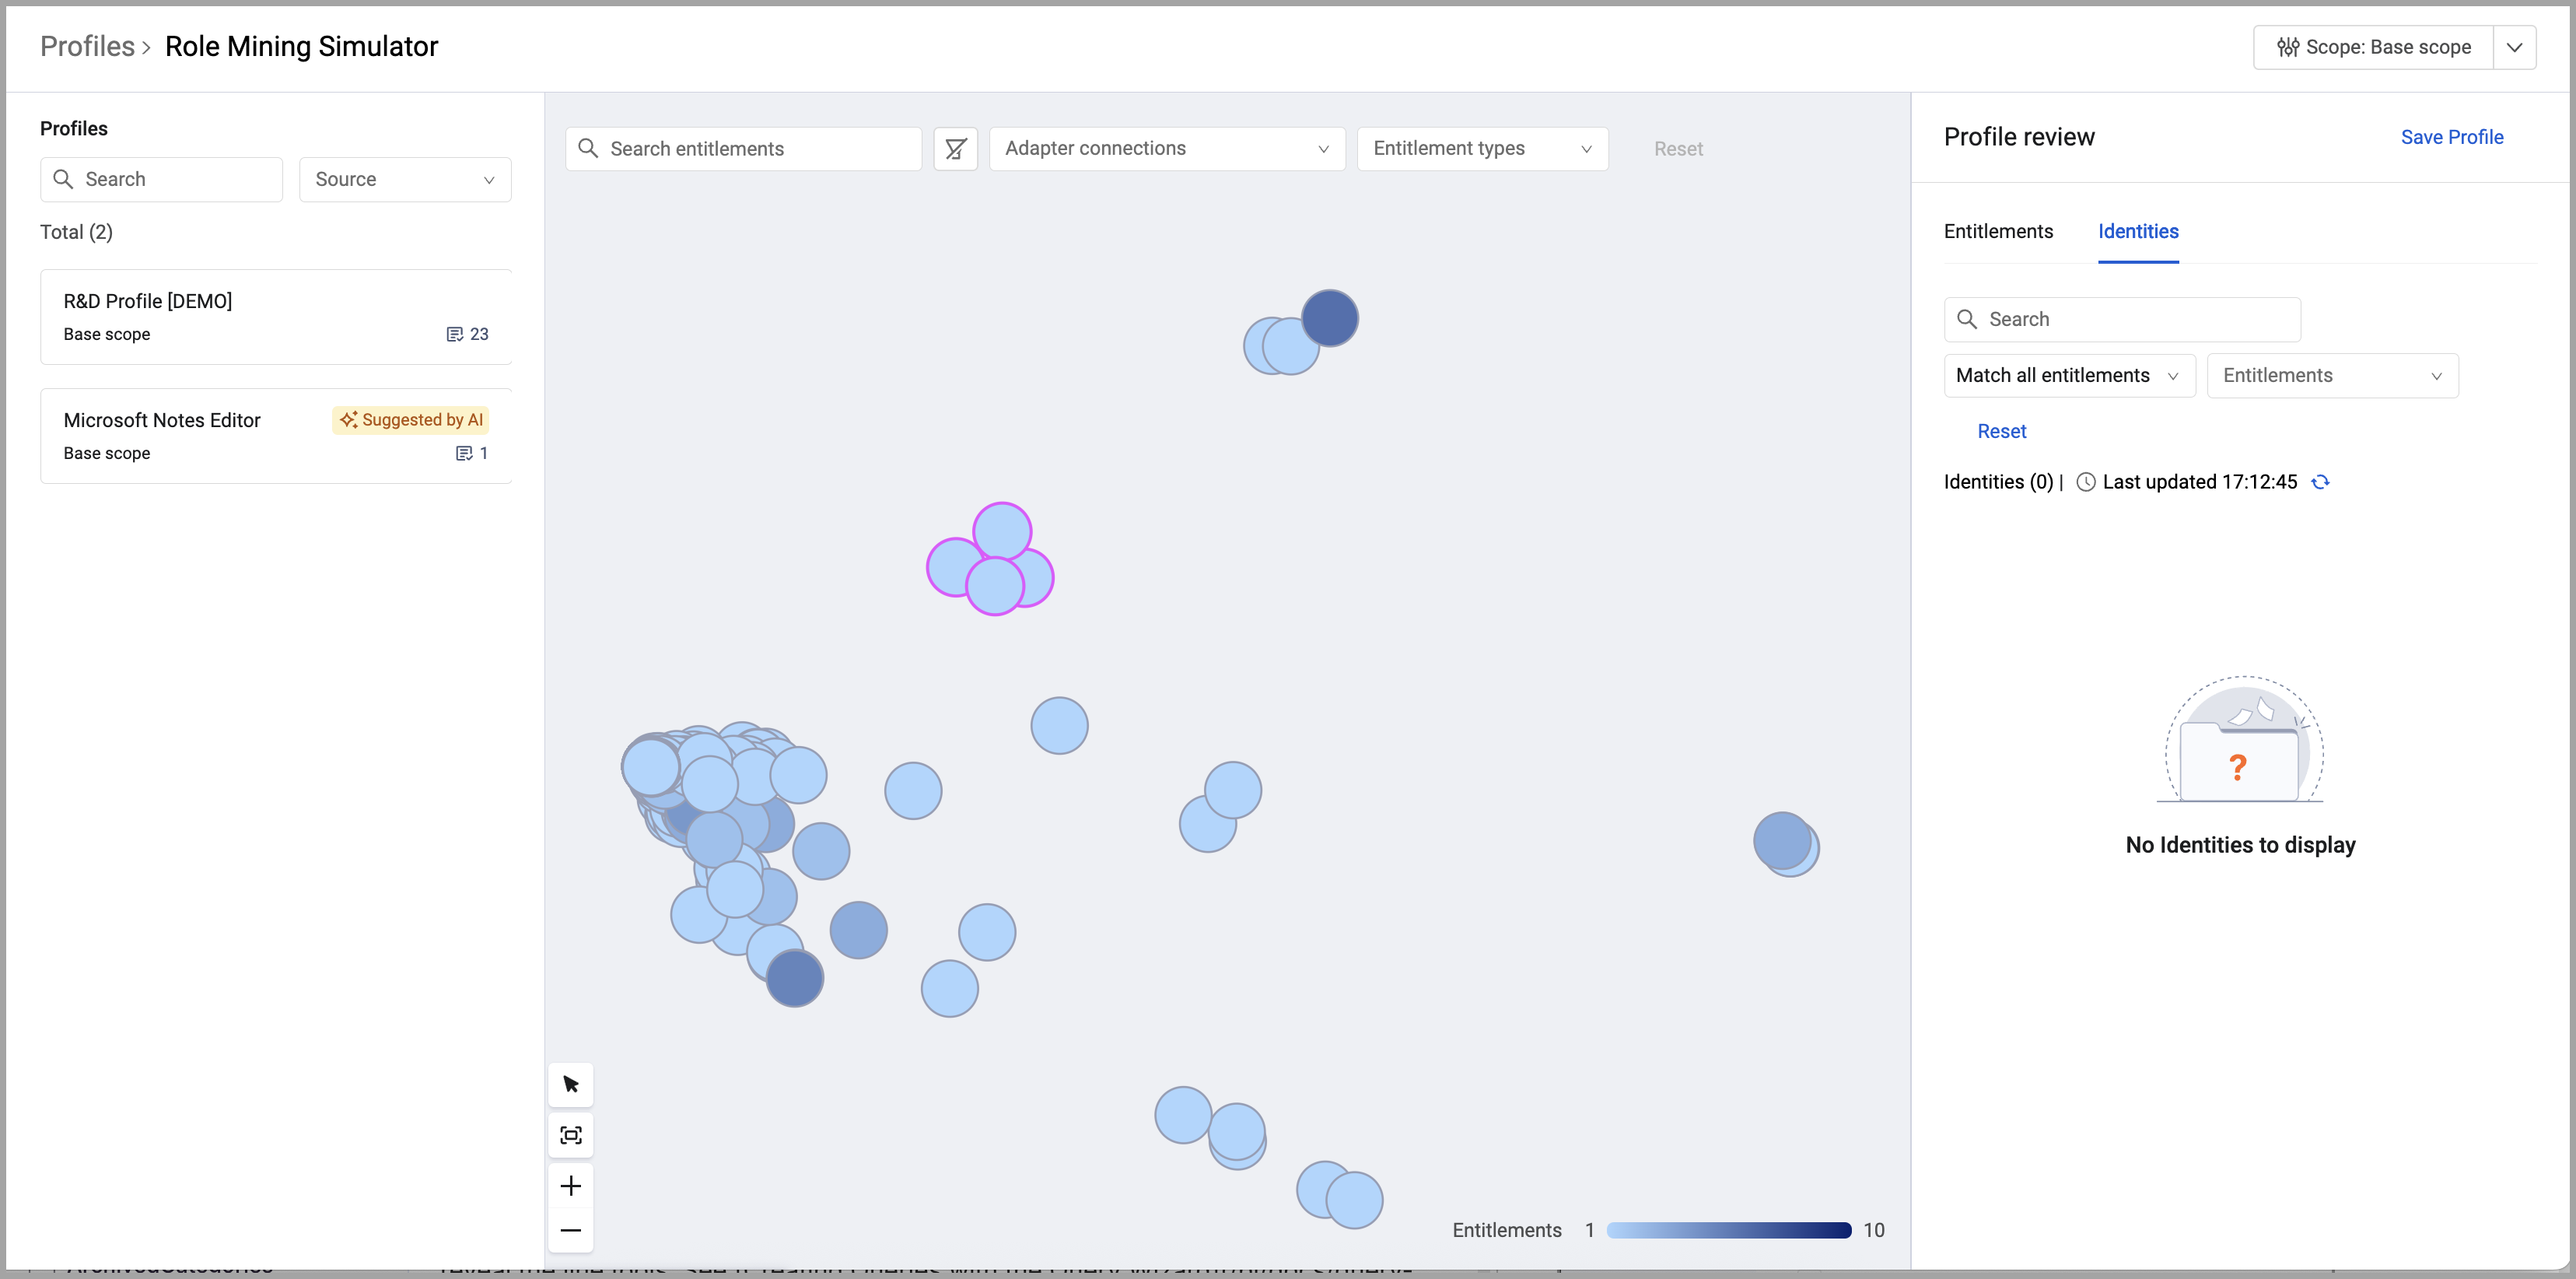
The Role Mining page has three sections:
- The left drawer lists the available profiles. Profiles are groups of entitlements that can be granted to identities as a unit. Some profiles may be suggested by Axonius' AI engine.
- The main part of the page is the simulator graph.
- The right drawer is the Profile preview and lists the entitlements and identities represented by the selected nodes. It also gives you the capability to create a new profile (logical group of entitlements) from the listed entitlements.
Hover over a node to see information about that entitlement.
The following information is displayed:
- The number of entitlements represented by the node in parentheses next to the popup title.
- Account - The adapter connection label for the connection through which the entitlement was fetched.
- Entitlement - The name of the entitlement.
- Type - The entitlement type: Group, Application, Permission, Resource.
- Identities - The number of identities that have been granted this entitlement.
How the Graph Works
The Role Mining graph is specifically designed for analyzing entitlement and identity information.
Graph Input and Output
The input to the simulator is the data defined by the scope.
Note
See Working with Scopes to learn about creating and managing scopes.
This is the data that the Axonius ML engine will analyze. The output is the graph showing the nodes where each node represents one entitlement.
Use scopes to focus the simulation on specific segments of your organization or system. The graph only shows entitlements granted to identities that are included within the applied scope. For example, if you have multiple Okta accounts, you can use a scope to simulate the entitlements granted via that Okta connection.
Interpreting Graph Nodes
Each node in the graph is an entitlement. One identity that has two entitlements will appear on the graph as two nodes, one for each entitlement.
The closer the nodes are, the more identities have that entitlement. A darker node indicates that multiple entitlements are granted to the exact same identities.
For example, suppose there are two groups in Okta, group A and group B. The identities in group A are completely different than those in group B. They don't share any members. The node representing the entitlements for these two groups will be far apart from each other. The more identities that have the same entitlements, the closer the nodes on the graph.
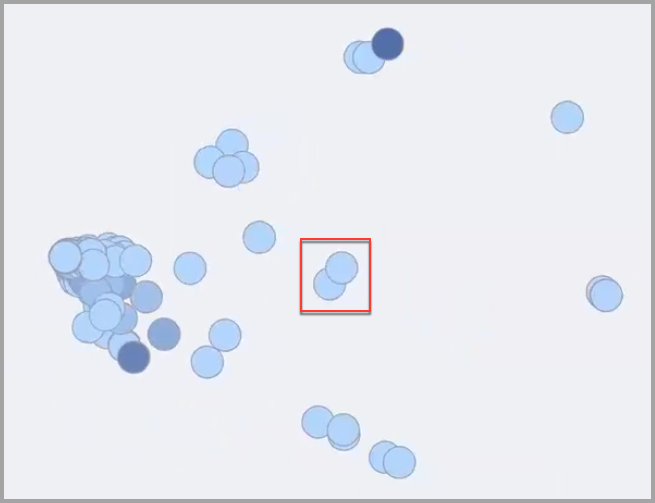
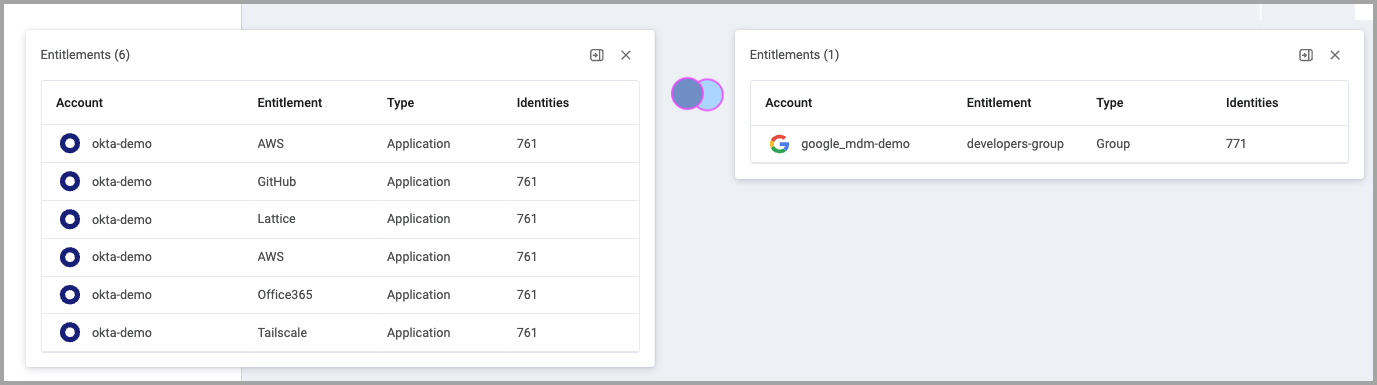
Overlapping nodes indicate that the entitlements are granted to some of the same identities but not an exactly matching list.
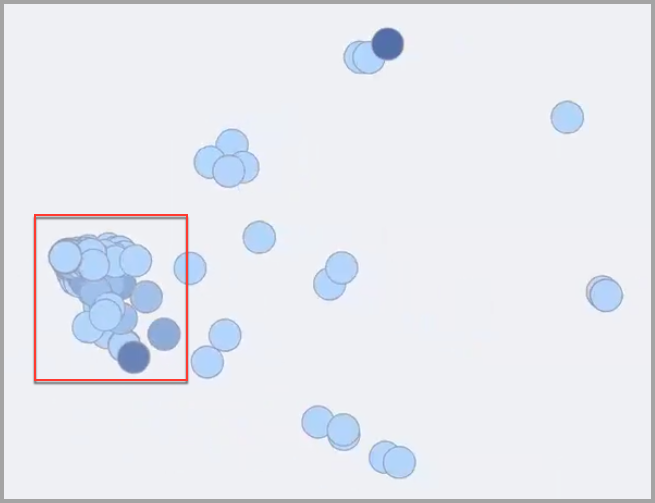
A cluster of nodes indicates that there are entitlements that are granted to many of the same identities included in the scope but not to an identical list of identities. The closer the nodes, the more identities share those entitlements. The nodes will overlap each other and the color of some of the nodes will be darker indicating that more identities have that entitlement. In this example, these are entitlements that most members in the scope have.
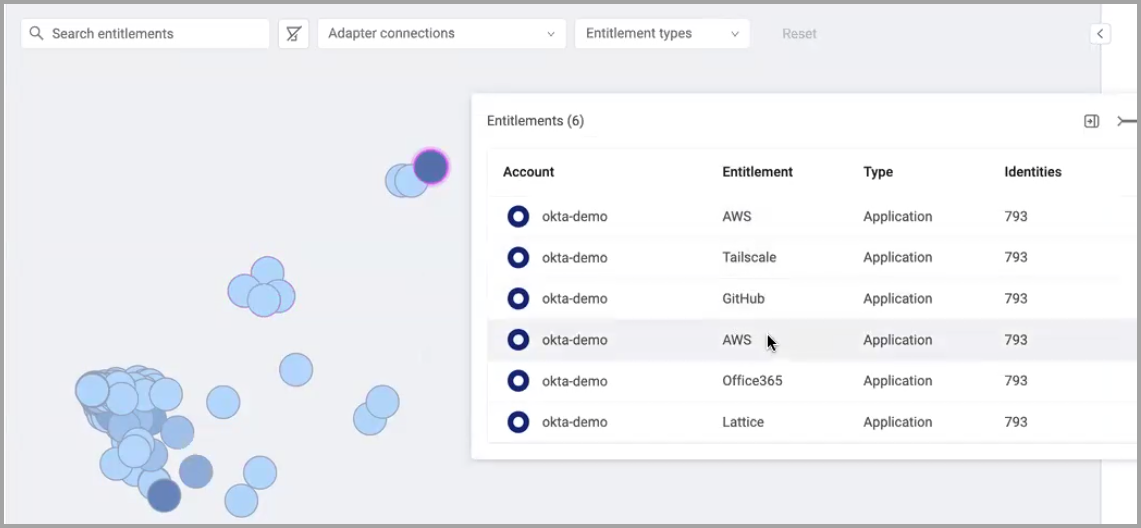
In the example below, the selected node is dark and the Entitlements popup shows that there are actually 7 nodes stacked in the same location because all the entitlements are granted to the same identities. In this case each of these 7 entitlements has been granted to 793 identities.
Note
It is important to understand that the number of identities with an entitlement depends on the applied scope. A scope could be defined such that not every identity granted a specific entitlement will be included in the scope and therefore not represented on the graph. For example, if a scope is defined to include only identities from a particular division or geographic region, identities in other regions may also have the same entitlements.
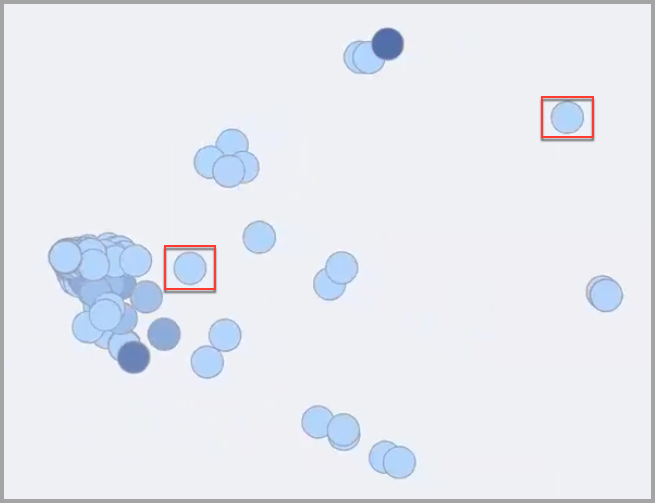
This example shows one entitlement that has been granted to 123 identities. The color is light since there is only one entitlement.
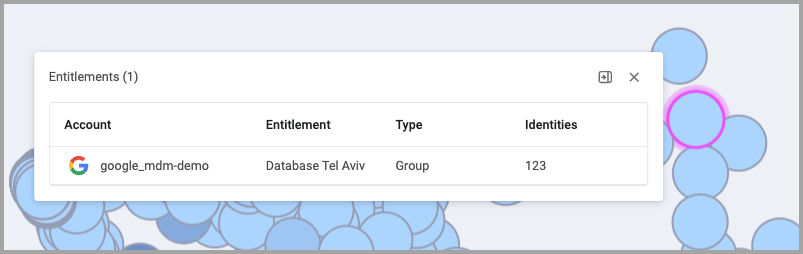
This clearly shows that the color of a node represents the number of entitlements and does not reflect the number of identities.
Viewing the Profile Review
Use the Profile Review drawer to see a list of selected entitlements and create profiles for entitlement groups commonly granted together. Additionally, you can see a list of all identities that have the selected entitlements. Also, by scrolling the lists you can get a quick glance whether there are anomalies and there are identities that should not have the selected entitlements.
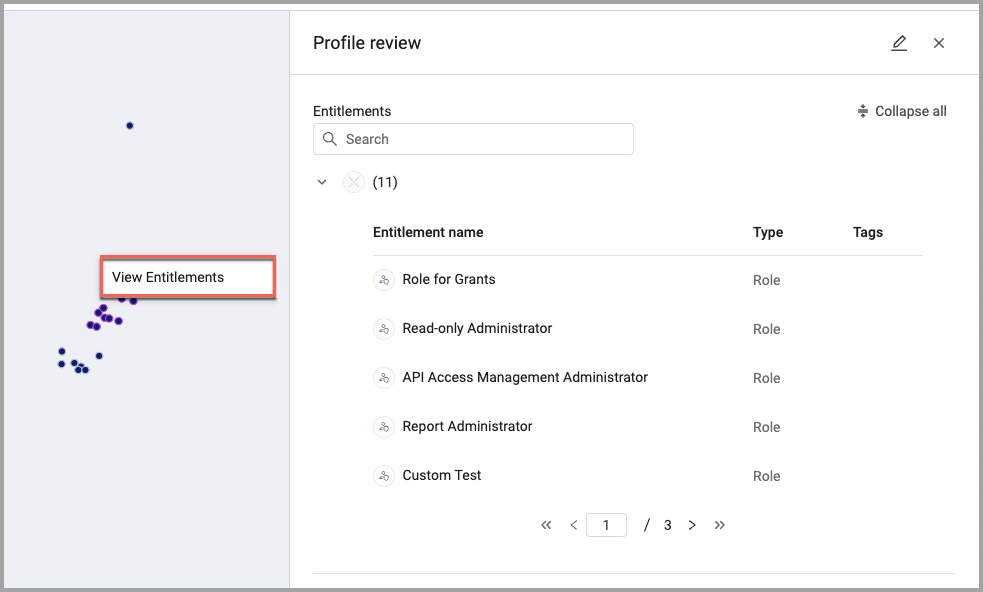
To view the Profile Preview drawer:
- Select the nodes you want to group together.
- Right-click and select View Entitlements.
- The Profile Preview drawer opens listing the entitlements of the selected nodes.
The drawer has two tabs: Entitlements and Identities
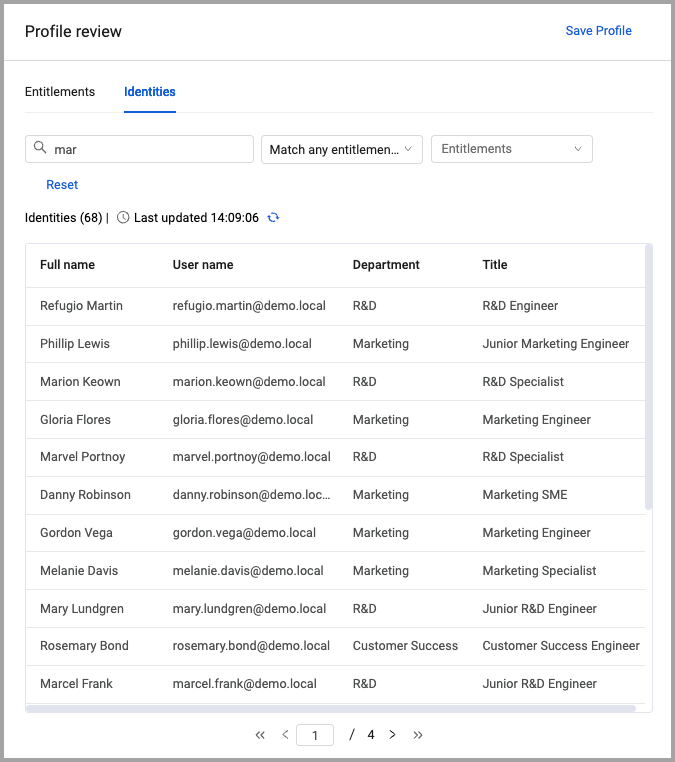
You can filter the list of entitlements by the following:
- Search - Enter text into the search box. All fields are searched for the entered text.
You can filter the list of identities by the following:
- Search - Enter text into the search box. All fields are searched for the entered text.
- Match any entitlements (default) - Identities that have at least one of the selected entitlements.
- Match all entitlements - Lists identities that have all the selected entitlements.
- Missing some entitlements - Lists identities that do not have some of the selected entitlements.
- Missing all entitlements - Lists all identities within the applied scope that have none of the selected entitlements.
Click Reset to clear the filters.
Creating a New Profile from Selected Entitlements
You can create a new profile from the entitlements selected on the graph. This is useful when there are nodes (entitlements) that are close together indicating that many identities have these entitlements. Creating a profile makes it easier to manage the entitlements and who gets them.
See Working with Profiles to learn how to create and manage profiles.
Zooming, Panning, and Selecting Nodes
Use the tools in the lower-left corner of the graph to zoom in and out, pan the graph, and select nodes.
To zoom in or out:
- Click
 or .
or .
To pan the graph:
- Click
 and drag the graph to the position you want.
To select nodes:
- Click
 and drag over the nodes you want to select.
Filtering the Simulator Graph
You can filter the data to show only what you want on the graph. Using the filter bar at the top you can filter by:
- Search - Enter text to find matching nodes.
- Adapter Connections - View only entitlements fetched from specific adapter connections.
- Type - Show only entitlements of a specific type.
- Application
- Group
- Permission
- Resource
- Role
Once you select criteria the graph is filtered immediately.
Click Reset to clear all filter selections.
Updated 8 months ago