
Working with Custom Charts
Use custom charts to create tailored dashboards that meet your specific needs.
Adding a New Chart
While the default dashboard charts contribute the first and immediate insights based on basic and known policies, you can leverage the dashboard to add additional custom charts. Additional charts provide a more complete and comprehensive view for your organization's custom policies.
To add a new chart:
-
Open the Dashboard page by clicking
 icon on the left navigation panel, select a dashboard and click Add Chart.
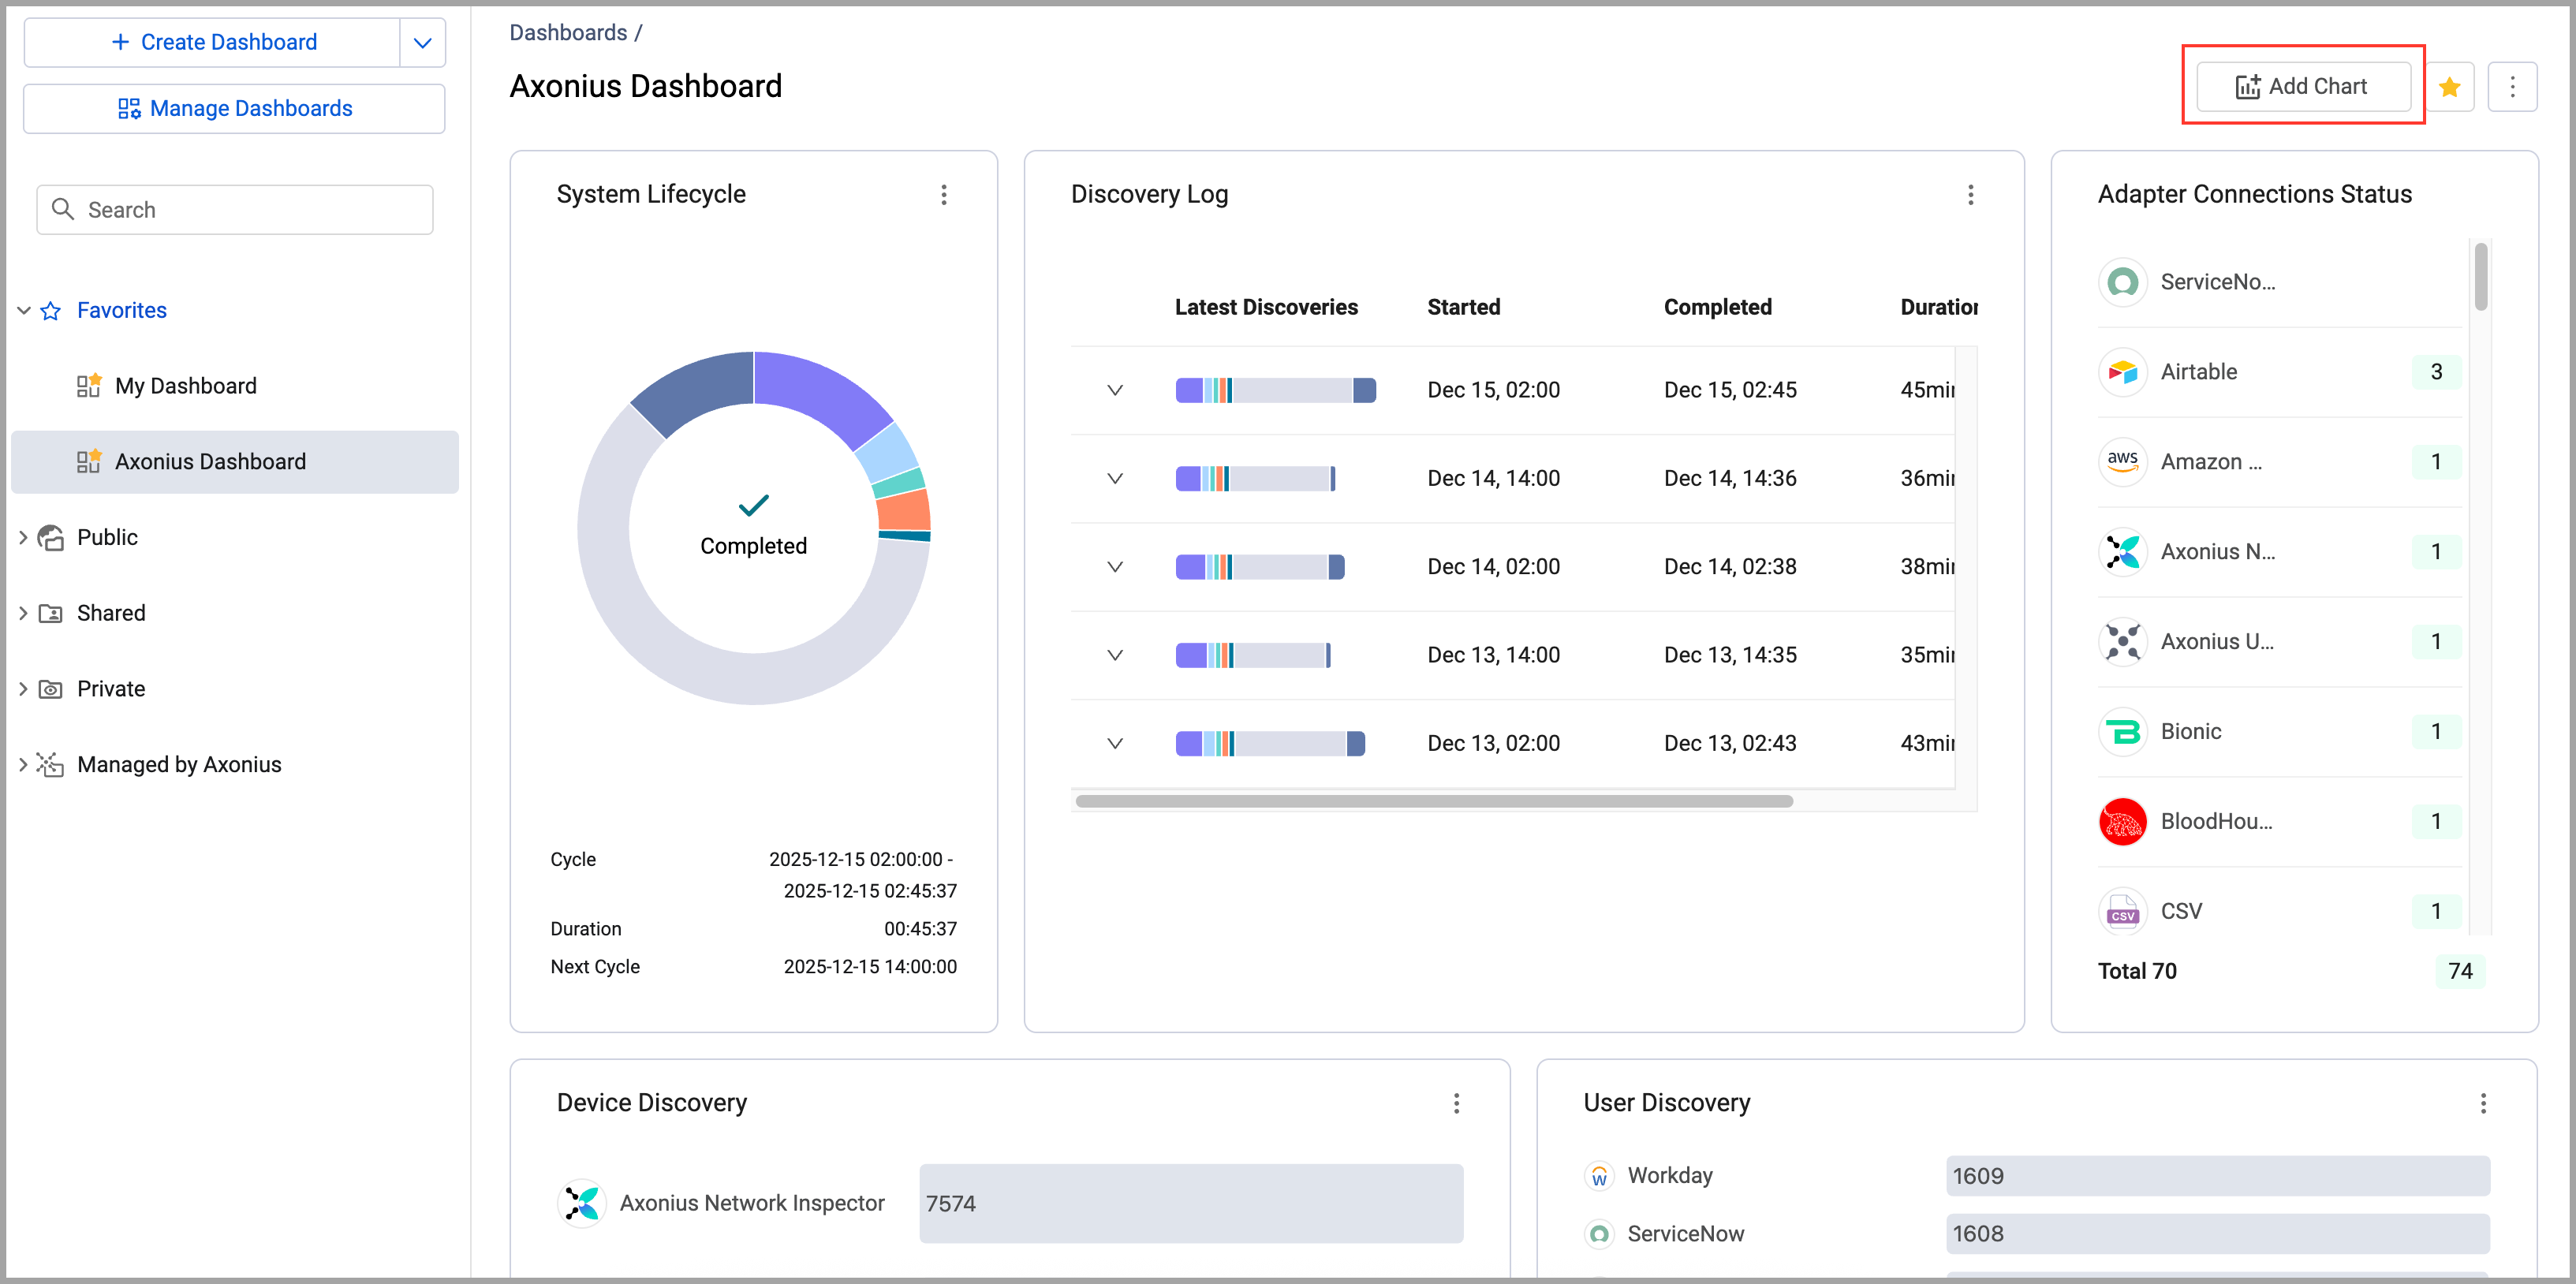
-
The Chart Wizard opens. Select a chart widget, enter a chart title, and set the configuration options for the visual/chart type and parameters according to the chosen metric.
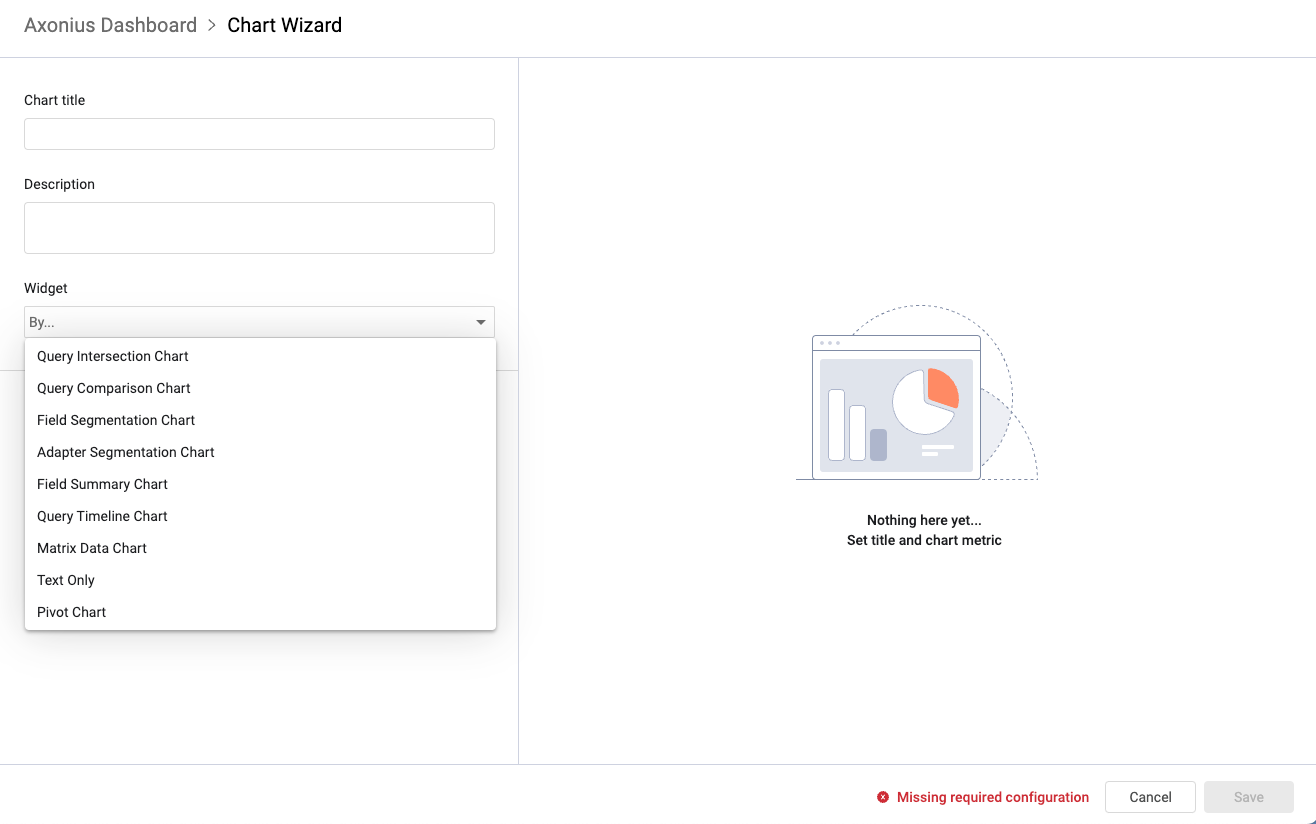
- The widget determines the type of measurement displayed. In a data context, these are the numbers or values that can be summed and/or averaged together with dimensions, which are the categorical buckets that can be used to segment, filter, or group.
- As you add metrics to the chart, a preview is displayed in the left preview pane.
- Visuals, like all other elements, are derived from saved queries. Some visuals relate to measurements that apply to multiple queries and while others relate to a single query:
- Multiple query metrics compare the number of results of different queries.
- Single query metrics segment or sum/average results of a single field of a query.
- You can create the following custom charts:
-
Click Save to create the chart.
Once created, use the chart actions to edit, remove, copy, move or refresh. Hover over the chart to reorder it or to pick a date in order to display historical data. For details, see Chart Actions.
Display a List of the Assets Represented by a Chart or Chart Section
Use chart click-through to verify your chart configuration. When configuring a chart, you can click on a chart segment in the preview to open a list of those assets represented by that section.
When viewing a chart on a dashboard, you can click on some charts or their chart sections to display a table listing those relevant assets, similar to what you see when clicking on a chart section in the chart preview. The columns of the table will be updated to reflect what is displayed in the chart.
Updated 7 months ago