
Using Saved Filters
You can create dynamic dashboards for specific needs that give you the exact information you want, when you want it. By applying saved filters to an entire dashboard, you can focus on specific datasets without having to manually adjust each chart.
For example, if your company operates in multiple regions, you can build one dashboard and apply a saved filter for each geographic region. This way, each regional team can see a personalized view of their data, while you maintain a consistent dashboard design across the entire organization.
The filters you set on your dashboards are sticky, so once you configure a dashboard to show only the data relevant to you, it will remember that setting even if you navigate away and come back later. This means you don't have to waste time re-filtering your view every time you want to check your data.
- Each user can create and maintain their own saved filters.
- Saved filters apply to every chart in the dashboard and combine with the filters applied to individual charts.
- Multiple users can view the same dashboard each with a different filter applied.
- The Empty filter (no filtering) is the default filter for all dashboards.
- You can create saved filters for any dashboard except system dashboards and My Dashboard.
- Saved filters can be used when configuring reports. The filter used in a report does not have to be the same filter applied to the dashboard.
Notes
After upgrading to this version of Axonius (Version 7.0.9, or higher):
Dashboards viewed within 30 days of the migration will be automatically refreshed.
Dashboards not viewed within 30 days of the migration may need to be manually refreshed to see the latest data. A message will appear:
Once 30 days have passed since the upgrade, any dashboard with a saved filter applied that has not been viewed for 60 days may need to be manually refreshed to see the latest data. The refresh message will appear.
Dashboards with a saved filter applied that have been viewed in the last 60 days are still refreshed every 6 hours.

Required Permissions
The following permissions are required to filter a dashboard:
- Only Admins can manage saved filters.
- For Private dashboards - "Add and edit Private dashboards"
- For Public dashboards - "Add and edit dashboards"
- For Shared dashboards - "Add and edit for all data scopes"
Creating a Saved Filter
To create a saved filter:
- Display the dashboard to which you want to add a filter.
- Click Saved Filters and then New Filter.
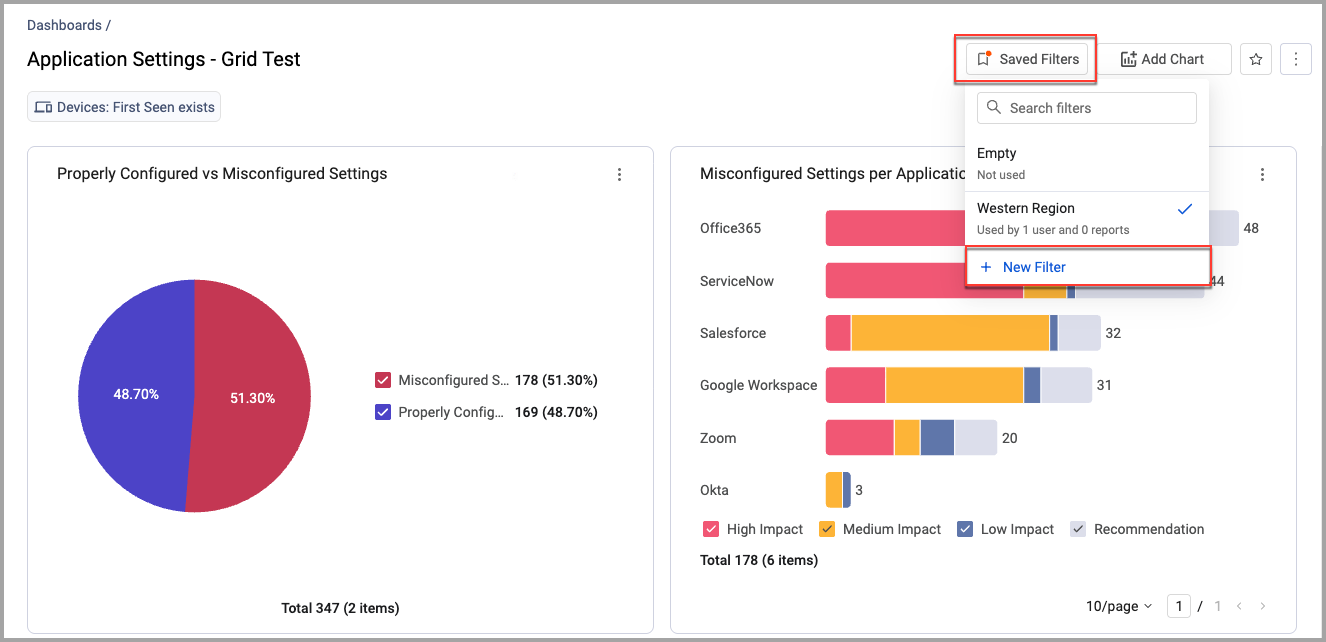
- In Filter Name, enter a descriptive name for the filter.
- In Asset, select an asset type and the filter parameters.
- Click Apply to save and apply the filter to the current dashboard.
Setting a Default Saved Filter
Users with Edit Dashboard permissions can now set a saved filter as the system default for a dashboard. The default filter applies automatically for users who have not yet selected a specific filter, giving teams a consistent starting view without overriding individual preferences. Only one filter can be set as the default per dashboard.
To set a saved filter as the default:
-
Display the dashboard for which you want to set a default filter.
-
Click Saved Filters.
-
Hover on the filter you want to set as the default, click the 3-dot menu, and select Set as System Default.
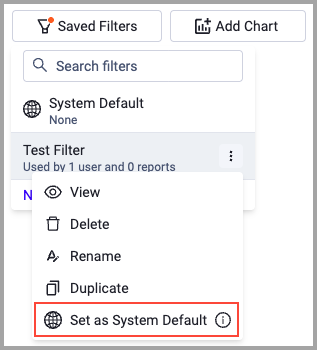
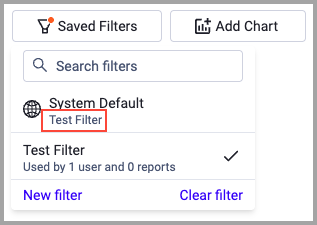
The filter is now applied automatically when users open the dashboard.
To remove the default filter:
-
Display the dashboard from which you want to remove the default filter.
-
Click Saved Filters.
-
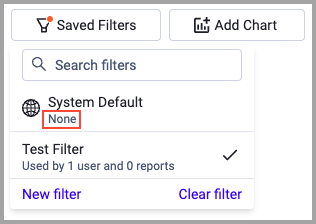
Hover over the System Default, click the 3-dot menu, and select Clear System Default.
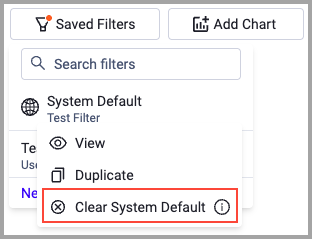
The dashboard reverts to the Empty filter (no filtering) as the default.
Applying a Saved Filter
To apply a saved filter:
- Display the dashboard whose data you want to filter.
- Click Saved Filters and select a filter from the list.
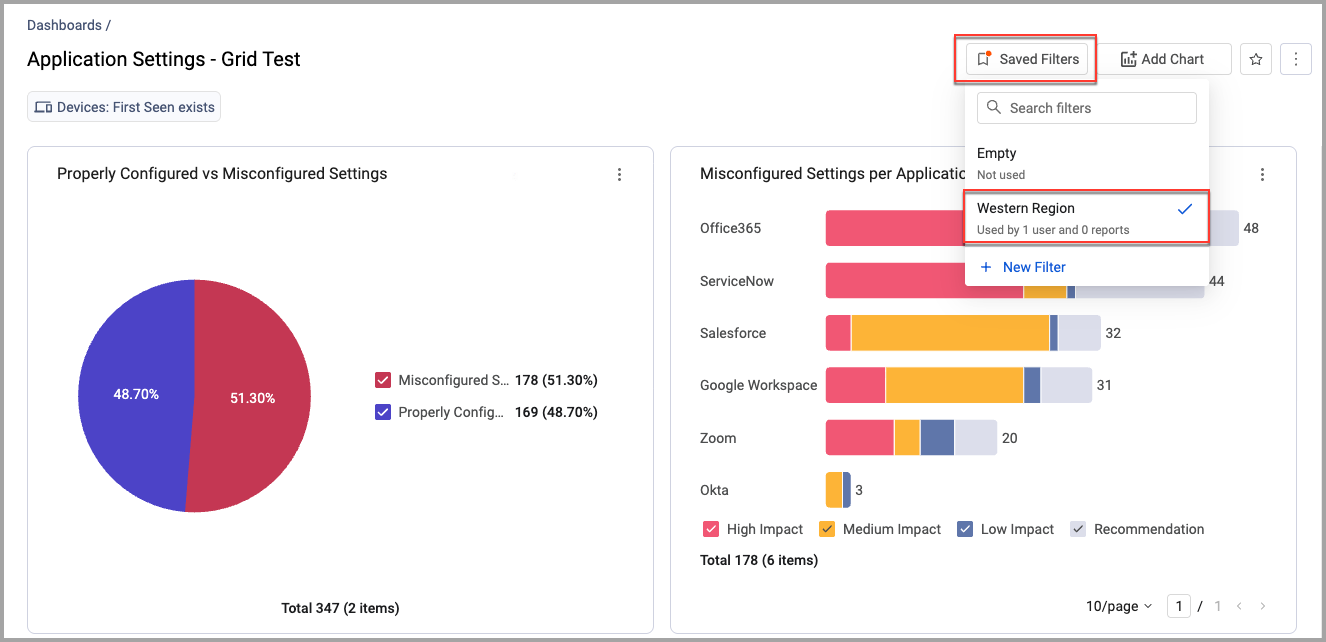
- The filter is applied to the data of each chart in the dashboard.
Removing All Filtering
To remove all filtering:
- Display the dashboard from which you want to remove filtering.
- Click Saved Filters and select the Empty filter.
Editing an Existing Filter
To edit an existing filter:
- Duplicate the filter you want to update and make your changes.
Viewing a Saved Filter in Chart Previews
When you edit a chart within a filtered dashboard, the saved filter applied to the dashboard is already applied to the chart in the Chart Wizard preview. You can view the filter query, but cannot change it there. It is controlled at the dashboard level. This action is only relevant for custom charts. 
Updated about 1 month ago