
Exploring Asset Correlation
Axonius automatically merges matching asset data from multiple sources into a single inventory record. Use the Explain Correlation / Explain non-Correlation modules to answer two core questions and understand the platform's decision-making logic:
- What triggered two different asset entities to correlate and merge into a single asset
- What caused two assets that were expected to correlate to remain separate assets
Notes
- This feature is supported for Devices only.
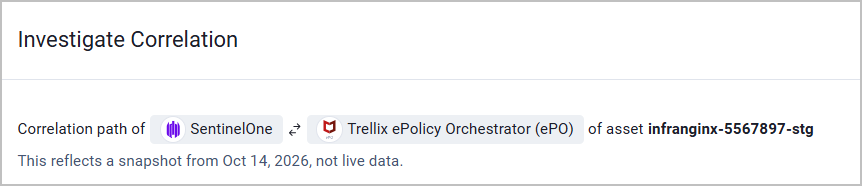
- Explaining correlation/non-correlation works in all table views: Live Data, Latest Snapshot, and Historical. When you are on Latest Snapshot or Historical view, it is noted at the top of the investigation panel, as demonstrated below.
Using this capability empowers you to independently solve issues that you experience due to over-correlation or under-correlation in your inventory, and makes your merge decisions auditable and defensible. By bringing complete transparency to your asset management, it ultimately increases overall trust in your inventory.
How this works: an Axonius-powered AI chatbot reads live correlation data from all available sources (adapter records, correlation reasons, normalization reasons) and produces both a textual explanation and a JSON-based visualization from the same internal analysis.
Example Use Cases
- As an auditor reviewing the organization's asset inventory, you want to select two asset entities under one expanded device and figure out why they were merged, so that you can verify the merge is correct without filing a ticket.
- As a security analyst, you want to see every field that contributed to a match, not just one; so that you don't mistake a well-founded multi-field merge for an arbitrary decision.
- As a security analyst investigating a historical or renamed asset, you want to see that correlation is preserved through a decommissioned or renamed asset entity, so that you don't mistake it for a bug.
- As a CS/TAM, you want your customers to be able to self-diagnose common correlation questions, so that fewer of these escalate to support.
Exploring Device Correlation
The following procedures apply to the Devices page.
Explaining Correlation
-
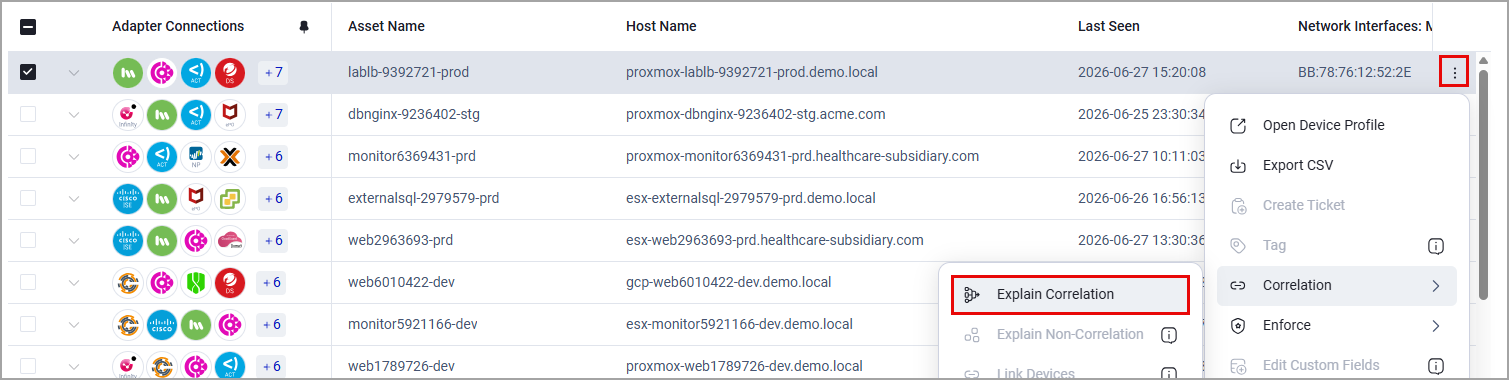
Select a device from the table and click the Actions (3-dot) button at the right of the row.
-
Select Correlation > Explain Correlation.
-
A dialog box apppears, listing all adapters that reported this asset. From the list, select two adapters to compare their reported asset entities and investigate what led them to correlate. Then, click Explain Correlation.
-
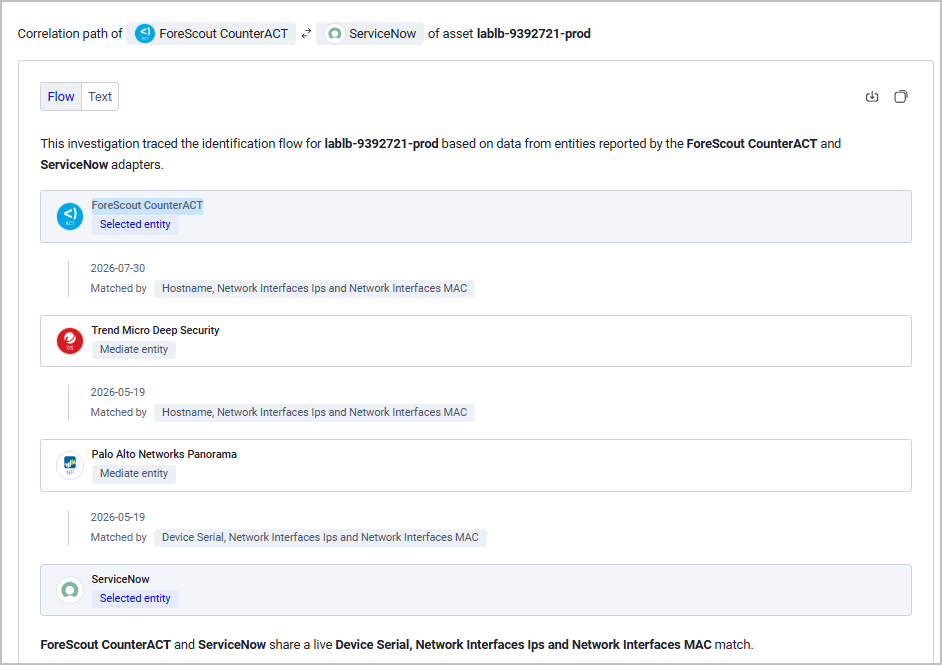
The Investigate Correlation drawer opens. This drawer details the step-by-step chain of the two adapters you selected for this asset, which are connected by mediate adapter entities. The genetral structure of this chain is as follows (the number of steps may vary, as well as the connection type on each step - historical or live):
Correlation Chain of Adapter A and Adapter BStep 1: Specific field values reported by
Adapter Amatch those reported bymediate adapter entity x.Step 2: Specific field values reported by
mediate adapter entity xmatch those reported bymediate adapter entity y.Step 3: Specific field values reported by
mediate adapter entity ymatch those reported byAdapter B.Conclusion: The asset entities reported by
Adapter AandAdapter Bhave matching field values that make them correlate.The date on which the match was found is noted on each step.
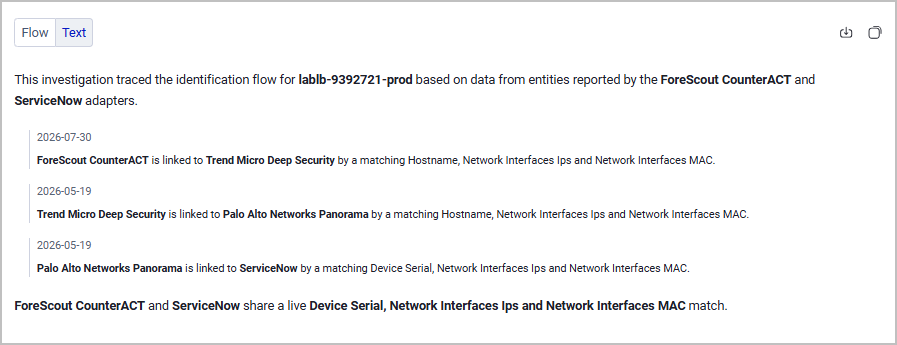
You can select to display the correlation chain in the form of a Flow (flowchart) or Text (written explanation).
Use the buttons on the top right of the drawer to download (in PDF format) or copy the correlation explanation - useful for compliance audit trails and support ticket attachments.
See below an example correlation chain of the ForeScout CounterACT and ServiceNow adapters for a selected device. Note that there is no direct link between these two adapters - They are connected transitively through two bridge records (Trend micro Deep Security and Palo Alto Networks Panorama):
AI Analysis
For customers with Axonius AI only:
To dig deeper into the correlation chain, click Ask AI at the top of the Investigate Correlation drawer. The AI chatbot can provide you with the following information:
- A detailed analysis of the data on each step of the chain
- Reliability assessment - a detailed list of all the signals that make this correlation more reliable or less reliable
- Over-Correlation (assets entities wrongly matched) / Inconsistency Check
- Investigation of cases where a visualization or explanation could not be generated for the select asset and adapter entity records
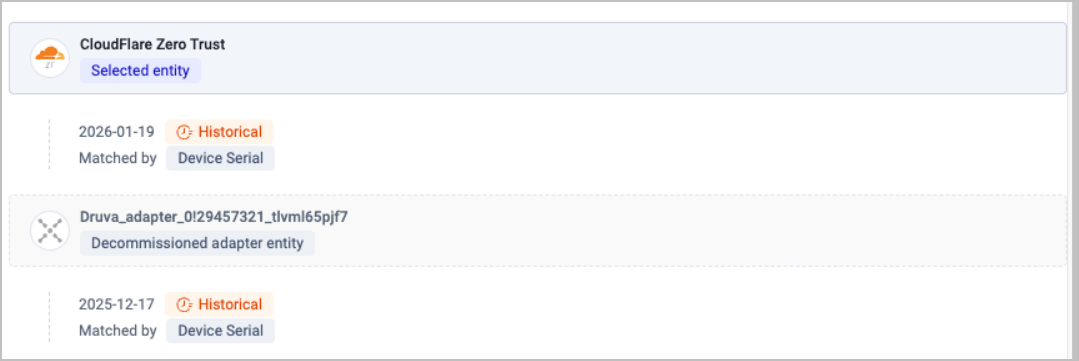
NoteIf an adapter connection is historical (no longer active), a
Historicaltag appears next to it. In this case, note that the field match was last confirmed before this adapter entity was decommissioned - it is not a live match.
Explaining Non-Correlation
-
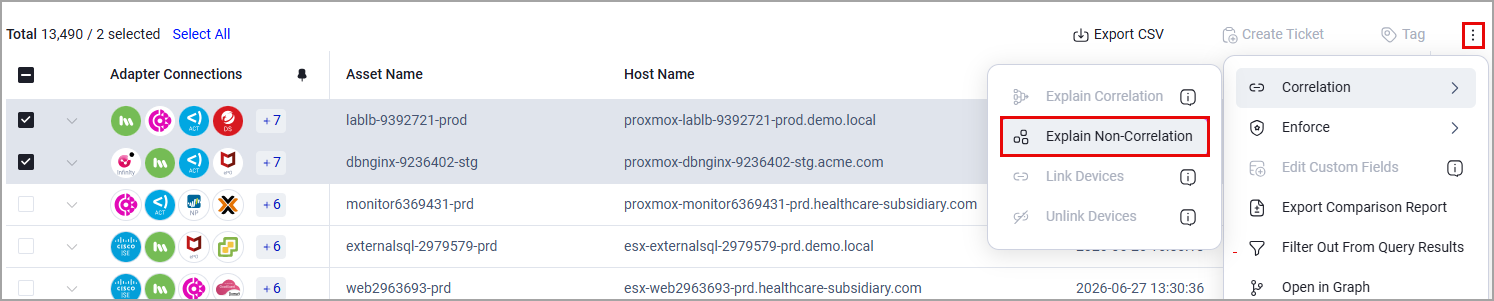
Select two devices from the table.
-
Click the More Actions (3-dot) button above the table.
-
Select Correlation > Explain Non-Correlation.
-
The Investigate Non-Correlation drawer opens. This drawer shows an identifier-by-identifier breakdown of all compared fields, the outcome of each comparison step (Contradiction, Missing Value, or Match), and a note explaining how this outcome was achieved, when an explanation is available.
Possible Outcomes
Each step in the investigation chain can have one of the following outcomes:
| Outcome | Reason |
|---|---|
| Contradiction | The compared field values don't match |
| Missing Values | One or both the compared fields didn't report any values for comparison |
| Match | The compared fields have matching values, but it is not enough for correlation due to either of the following reasons:
|
AI Analysis
For customers with Axonius AI only:
To dig deeper into the path that led to non-correlation, click Ask AI at the top of the Investigate Non-Correlation drawer. The AI chatbot can provide you with the following information:
- A detailed analysis of the data on each step of the chain
- Reliability assessment - a detailed list of all the signals that make this non-correlation more reliable or less reliable
- Under-Correlation (assets entities wrongly separated) / Inconsistency Check
- Investigation of cases where a visualization or explanation could not be generated for the selected asset records
Updated about 1 hour ago