
Overview Dashboard
The Data Hygiene Overview Dashboard displays out-of-the-box widgets in two main sections.
Note
- This dashboard is managed by Axonius - you cannot edit charts or create new ones.
- You can access this dashboard directly from the Dashboards Page, under the Managed by Axonius category.
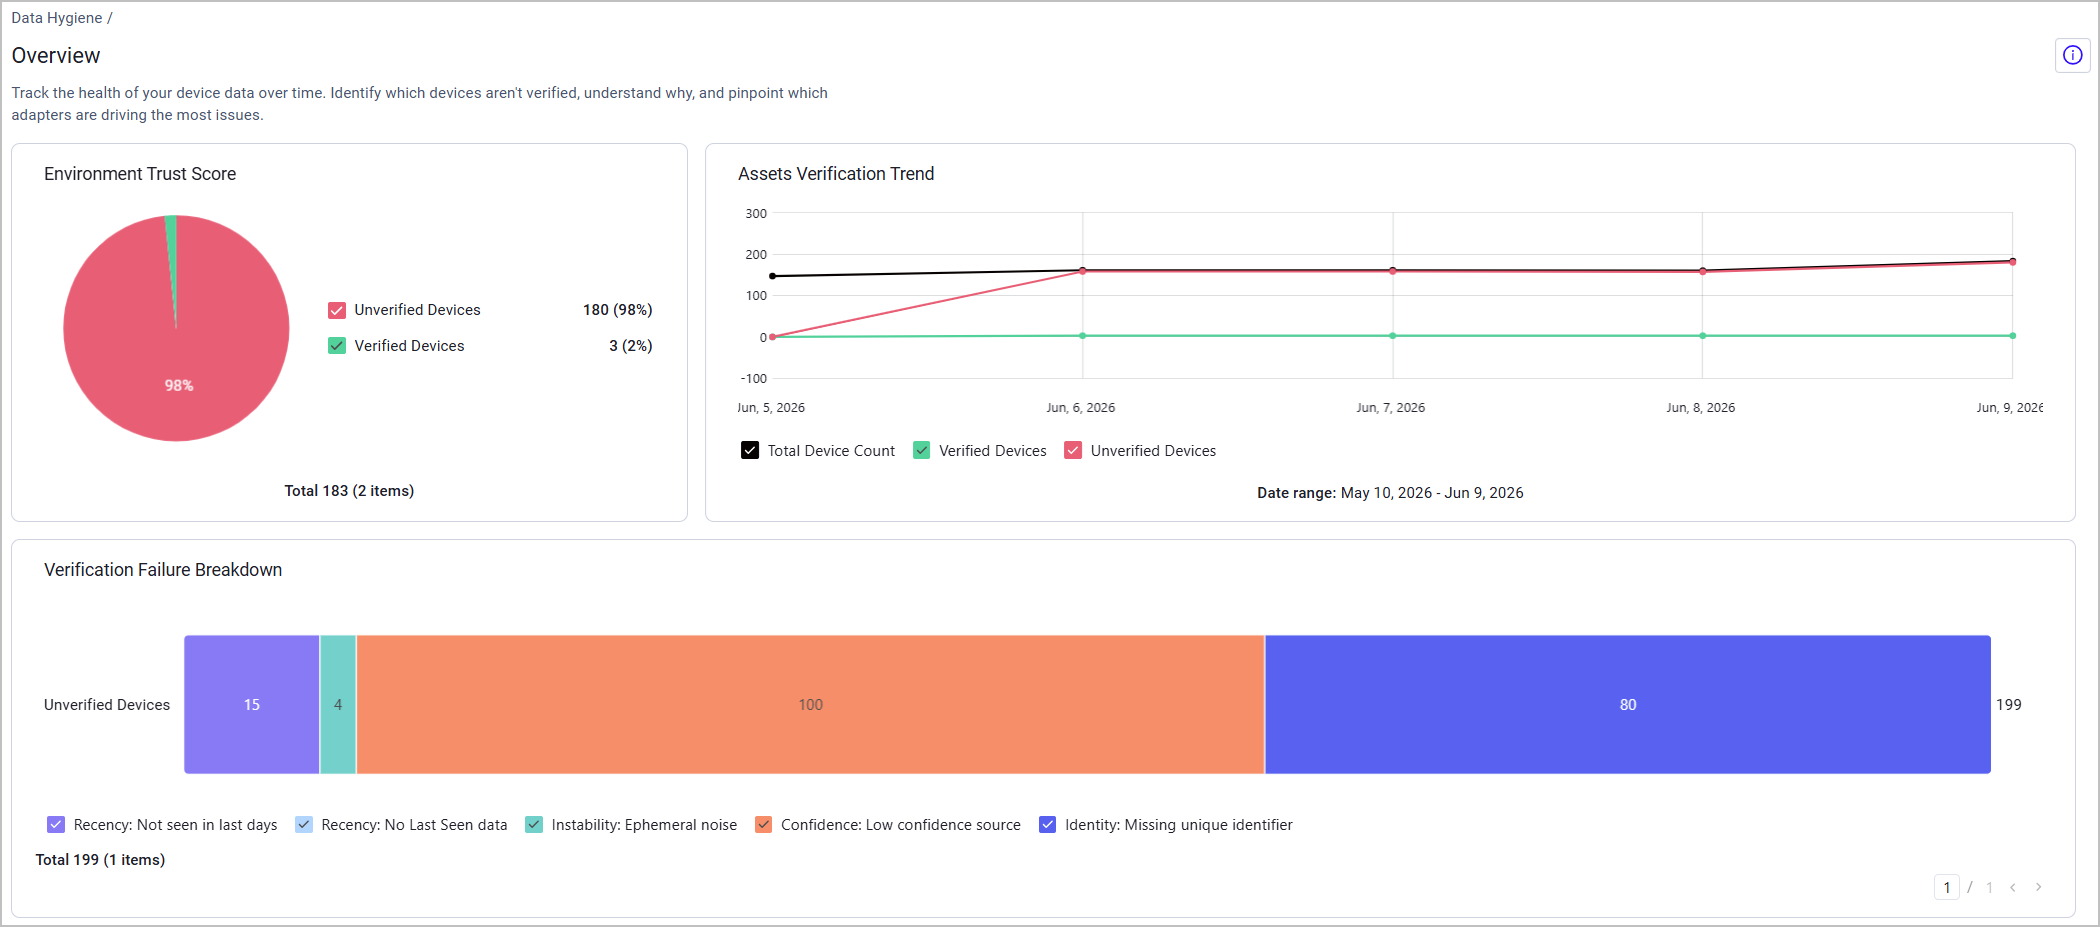
The "Trust Score" Section (Health Metrics)
This section shows the overall health of your device inventory - Verified vs. Unverified devices in total, Verification Trends over time, and a Verification Failure Breakdown - the distribution of unverified devices across the different verification gates. Note that some devices might fail more than one gate, so the total number presented in this chart might exceed the general Unverified Devices count.
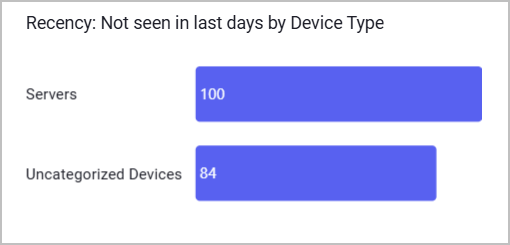
The "Triage Center" Section (Data Breakdown)
This section helps you identify all unverified devices by breaking them down to their verification failure reasons - which gate(s) each device failed to pass.
Each dashboard in this section represents a gate: Recency, Identity, Instability, and Fidelity (Low Confidence Source). If a gate is disabled, the dashboard representing it is not shown.
Each Unverified Devices dashboard comprises the following charts:
-
The total count of devices that failed to pass this gate, for example, the Identity dashboard displays how many devices are missing a unique identifier.
-
A breakdown of all unverified devices by specific types and other attributes. For example, the Recency dashboard breaks down the unverified devices into Servers and Uncategorized Devices.
-
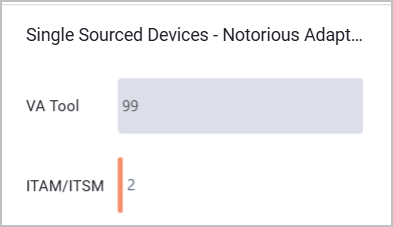
The distribution of unverified devices across specific adapters. This way you can recognize which adapters drive the most issues.
-
The Fidelity dashboard also displays a breakdown of devices across notorious adapter categories.
-
Updated 29 days ago