Monitoring Alerts
The Alerts/Monitoring Assets page provides a centralized view of all alerts generated by rules configured in Monitoring. It shows all alerts based on a selected query (shown above the search bar) or all alerts, if no query is chosen. By presenting Alerts as standard Axonius assets, this page enhances your ability to track, monitor, and use alert data across the platform, including in the Enforcement Center, Workflows, and Dashboards.
See Monitoring for more about creating and managing monitoring alerts.
Required Permissions
You need permissions for Alerts/Incidents assets and Findings, in order to view this page.
To open the Alerts/Monitoring assets page, click the Assets icon and from the left pane, under Alerts/Monitoring, select Cases.
In Axonius New Navigation Experience from the Inventory menu, select All Assets and from the left-pane, under Tickets, select Alerts/Monitoring.
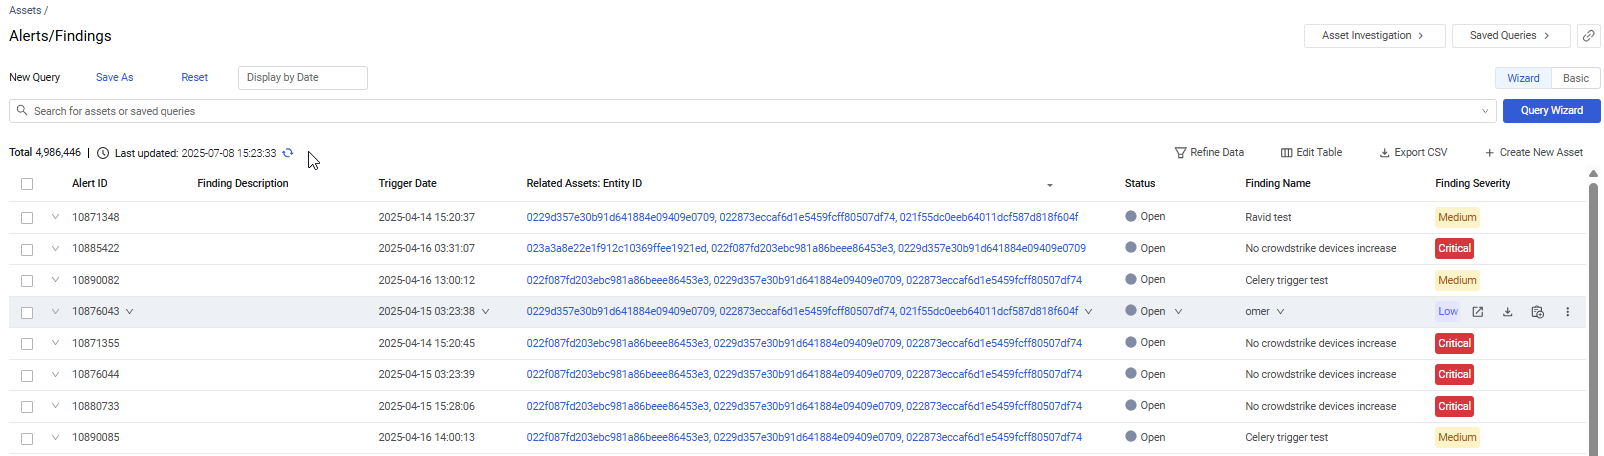
For each Monitoring Alert, the query results table displays multiple columns.
Alert Fields
There are many fields that you can view and query on the Alerts/Monitoring page. This includes the following fields:
-
Alert ID - ID number of the alert.
-
Rule Description - Description of the rule.
-
Trigger Date - Timestamp in UTC that the rule triggered the alert.
-
Related Assets: Entity ID - Complex field that shows assets which triggered the alert.
- This field displays the IDs of the assets related to the Monitoring Alert.
- Click an ID to open its asset profile page. For example, if the related asset is of type User, clicking it opens the user's asset profile page.
-
Status - Status of the alert. Available statuses: Open, In Progress, Closed, Canceled.
-
Monitoring Rule Name - Name of the rule.
-
Rule Severity - Severity of the rule. Available options are: Informational, Low, Medium, High, Critical. The severity of an alert is equivalent to the severity of the rule that triggered it.
-
Rule Asset Type - The type of asset being checked by the rule. For example, Devices, Application Settings, Adapters Fetch History,Tickets, Users, Groups.
-
Source - The source of the alert, i.e., Findings Center.
-
Tags - Tags associated with the rule.
Performing Actions on Monitoring Alerts
For single alert actions, hover over the alert and click an action at the end of its row. For bulk actions, select multiple alerts and choose an action from the top of the page. Refer to Asset Actions for details.
The structure of the Alerts/Monitoring page and navigating it are similar to all the Assets pages. For more details on the different elements and the navigation in the Alerts/Monitoring page, see Assets page.
Creating Queries
Use Queries to gain deeper insights into your Monitoring alerts. Create granular queries with various filters to easily drill down to Monitoring alerts that match your required search criteria. You can create queries using:
-
Query Wizard (default) - Build queries using the Query Wizard, or in the query bar, select a saved query or write your own.
-
Basic mode - Create queries by selecting filters.
Both modes allow you to create unique sets of queries tailored to your needs.
Learn more about creating Queries using the Query Wizard and Basic mode.
Viewing a Monitoring Alert Asset Profile
Click an individual asset row in Alerts/Monitoring to see all its relevant data. To learn more, see Asset Profile page.
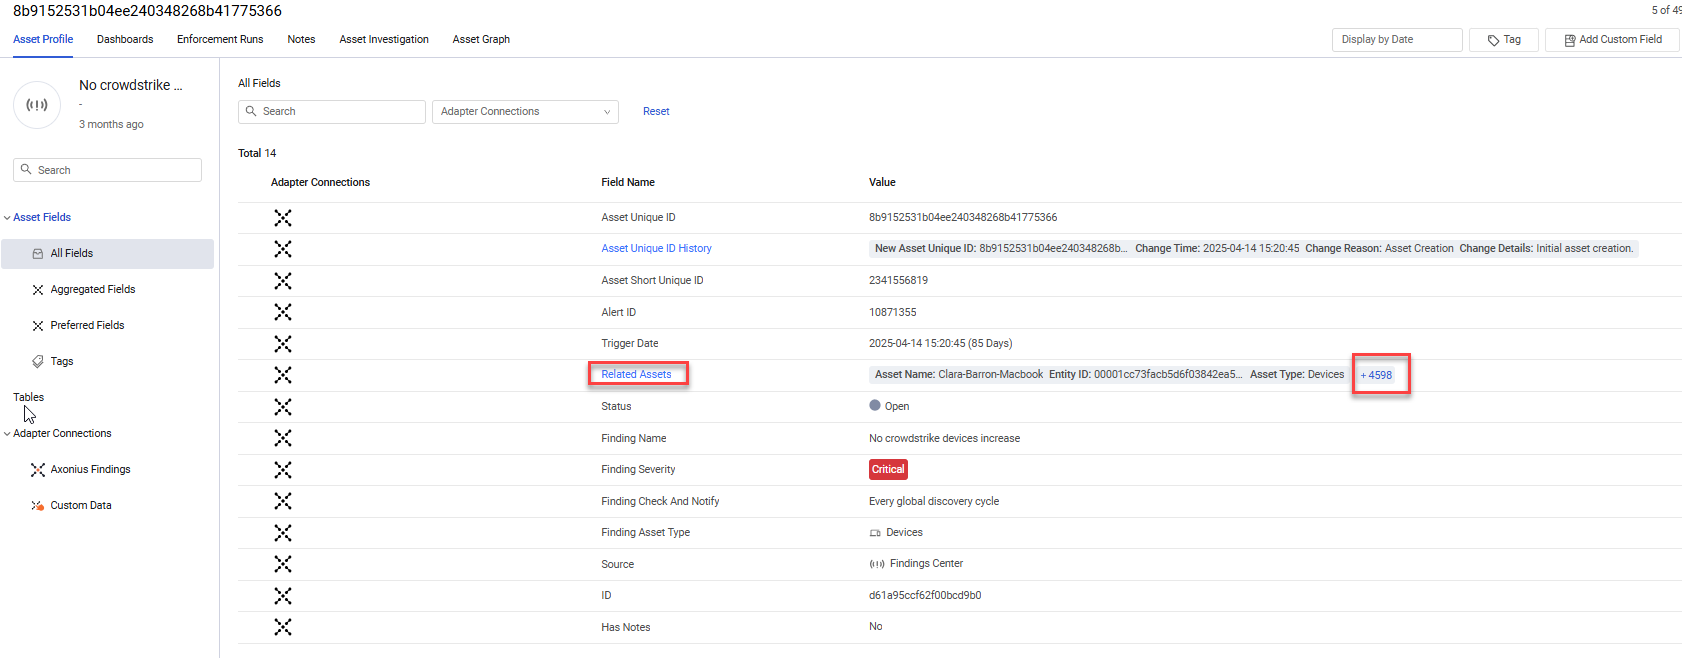
- In the Alerts/Monitoring asset profile page, the Related Assets field displays the information of the first asset related to the Monitoring Alert (Asset Name, Entity ID, and Asset Type), followed by
+and the number of additional related assets. Hover over the number to display the information on the top 10 additional assets.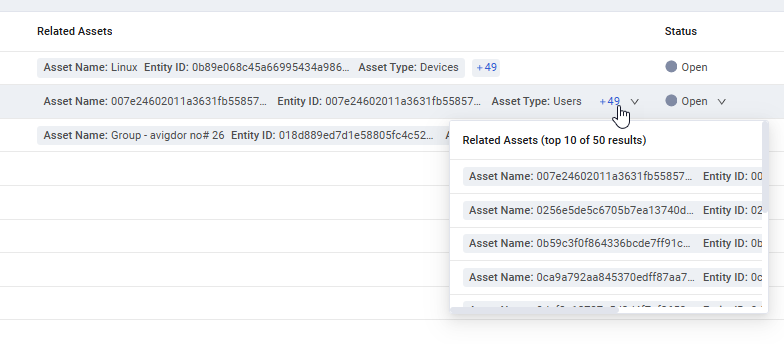
- To view the Related Assets complex field: In the left pane, under Tables, click Related Assets. Alternatively, click the Related Assets link in the Asset Profile.
- Learn more about the Related Assets complex field.
For general information about working with tables, refer to Working with Tables.
Updated 2 months ago