Exposure Overview Workspace
Explore the Exposure Overview Workspace to track, assess, and mitigate risks across your IT ecosystem. Learn about critical security findings, risk scores, and time to resolution metrics.
Exposure Overview offers a holistic approach to tracking, assessing, and mitigating risks across your entire IT ecosystem, ensuring comprehensive risk oversight. This workspace highlights the most critical risks across your most critical assets against metrics such as SLA and Time to Resolution. This approach helps teams identify risks faster, prioritize remediation efforts, and demonstrate clear progress in your security initiatives, to eventually reduce the likelihood of a security breach.
Products Required for this Workspace
To access and use this workspace, you must have access to Axonius Exposures.
Adapters Recommended for this Workspace
To see valuable data in this workspace, we recommend you connect the following adapters:
- Tenable Vulnerability Management
- Tenable Security Center
- Rapid7 InsightVM
- Rapid7 Nexpose and InsightVM
- Qualys Cloud Platform
- Microsoft Defender for Endpoint (Microsoft Defender ATP)
- CrowdStrike Falcon
- Wiz
- Amazon Web Services (AWS)
- Palo Alto Networks Cortex XDR
- SentinelOne
- Snyk
Workspace Assets and Modules
Note
Each workspace has its own use-case-focused navigation menu on the left. The assets and modules available from this menu depend upon your access configuration.
You can access the following assets directly from this workspace:
Aggregated Security Findings Page
See Using Workspaces to learn how to generally access, navigate, and use workspaces.
Use Cases this Workspace Helps You Fulfill
The Exposure Overview's Home page displays charts and KPIs of special interest, divided into functional areas that help you focus on specific use-case information.
The data displayed on the charts relies mainly on the Risk Score settings you have defined for your assets. If needed, you can always change those settings to get the most accurate risk picture.
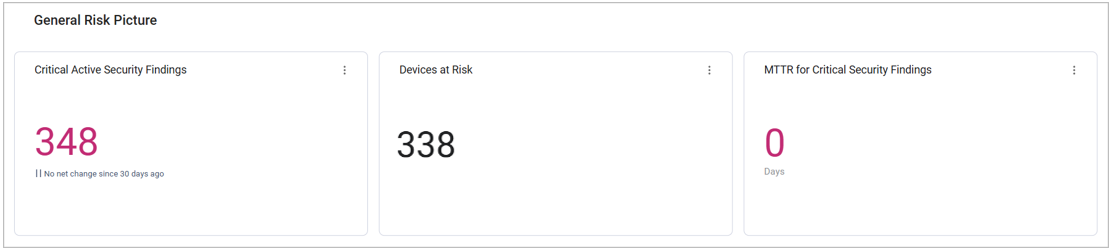
General Risk Picture
The Overview section at the top of the page provides a simple, straightforward view of your most critical issues and assets. It also includes statistics on changes that occurred over the past 7 or 30 days. This way you can see where you currently stand risk-wise and understand what to expect in the near future.
The Overview displays the following information:
- Current number of Critical, Active (open) Security Findings - the most urgent assets to take care of
- Current number of devices at risk (devices with Critical Axonius Risk Score)
- The MTTR (Mean Time to Resolution) of all closed Security Findings with a Preferred Age date. This field indicates how many days ago the security finding was open, and its value is calculated by deducting the Preferred First Seen date from the Preferred Last Seen date.
Identifying Risks Quickly
Comprehensive, up-to-date Risk Score data help you recognize risks ahead of time, prioritize remediation efforts, and ensure your teams focus on the highest-impact issues.
The workspace shows Risk Score data, both current data and statistics across your assets over time. For example: the Average Risk Score per device, which represents your Organizational Risk Score.
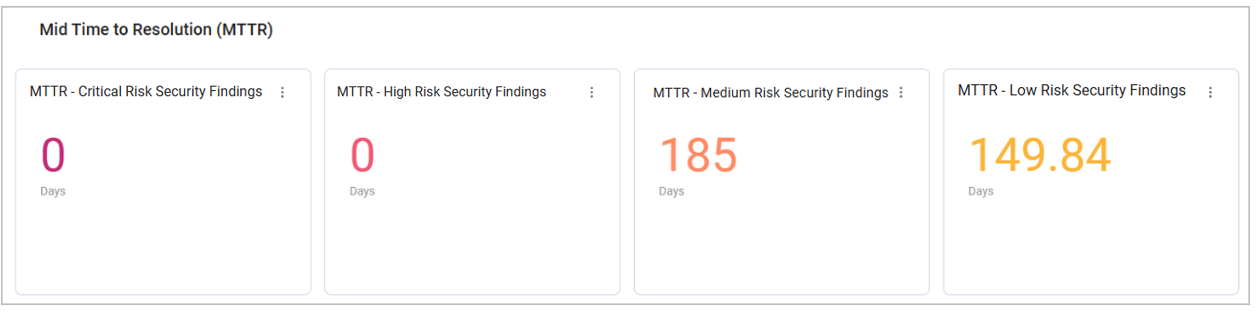
Time to Resolution Information
The most severe risks require the fastest reaction. Therefore, a key objective is that the MTTR of high-risk Security Findings will be significantly lower than the MTTR of low-risk Security Findings. Exposures Overview helps you track and visualize your MTTR and SLA efforts, and see whether they are meeting your organization’s objective.
For example, you can use the charts in this section to see the MTTR of Security Findings assets, grouped by Risk Levels.
Recognizing Security Findings Out of SLA
Reducing Critical Security Findings that are out of SLA is a key objective, mirroring the performance goals associated with Time to Resolution metrics. The primary focus is to ensure that non-compliant instances are kept to a minimum.
For example, you can use the charts in this section to see which Security Findings are out of SLA and compare the SLA data between different Risk Levels. This view helps you understand whether your resolution efforts are meeting the defined SLAs.
To see the actual out-of-SLA assets, click the number displayed in the chart. The relevant Assets table opens in a new tab, and from there, you can perform the following actions:
- Explore a specific asset on its Asset Profile page
- Create a ticket to escalate an asset, or send an email notification to its stakeholder using Enforcement Actions
- Adding assets to a case
Exploring Open Security Findings in Context
To understand the scope and impact of risks, it’s important to be able to zoom in on specific connections between assets and risks.
Use the charts in this section to see the number of open (unresolved) Security Findings in your organization, grouped by different parameters as demonstrated below.
For example, the Critical Risk Security Findings by Vulnerability ID chart shows Critical Security Findings grouped by Vulnerability ID. Hover over an ID to see its percentage out of the total security finding count.
As demonstrated below, the CVE-2024-4358 vulnerability has 22 instances across the environment, which are 9.05% of all Security Findings:
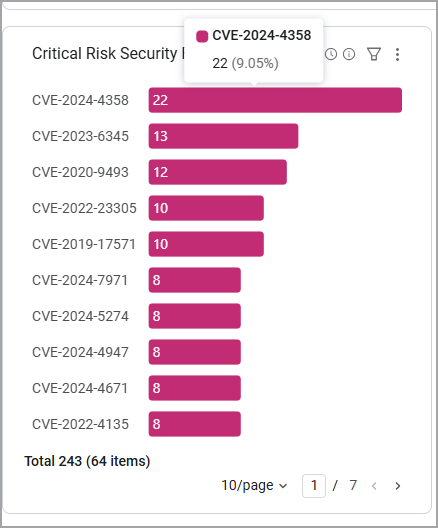
Click on a Vulnerability ID to view the Security Findings Assets page filtered by this specific ID. This way you can see all of its instances, including the asset types and hostnames it exists on.
After you focus in on this vulnerability, you can take the following actions:
- Explore a specific instance of this security finding on its Asset Profile page
- Compare this security finding’s Risk Score across the assets it exists on
- Implement remediation workflows such as opening tickets and cases
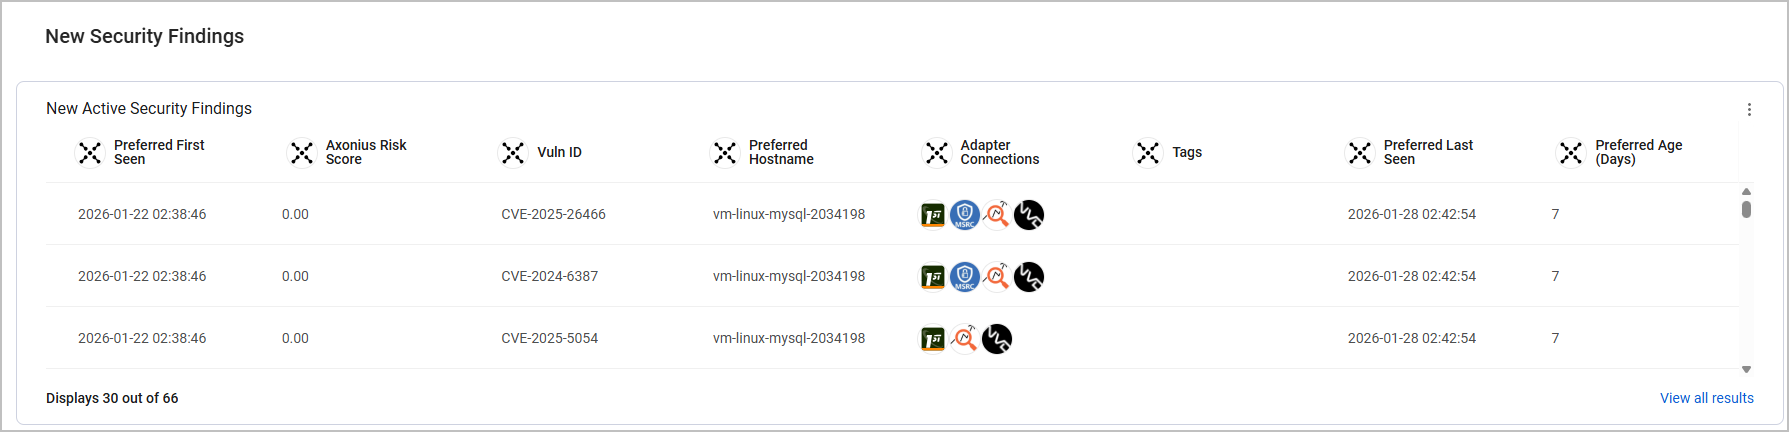
New Security Findings
This section shows all new Security Findings, with a specific focus on Critical, Active Security Findings.
The data is displayed as an Assets Table. Click View All Results to navigate to the Security Findings Assets page.