SaaS Applications Asset Page
Use the SaaS Applications page to see a consolidated view of all SaaS applications in the Axonius Catalog and applications detected in your organization.
The SaaS Applications page delivers increased management and oversight over the various applications used in your organization. It helps security, IT, and risk teams understand:
-
How each application is managed
-
What level of security risk is posed by each application
-
Who is using each application
-
Whether their SaaS accounts are paid or unpaid
-
Which security standards an application is compliant with
-
and more...
Click the Assets icon and from the left pane, select SaaS Applications.
Overview Charts
The Overview section contains three visual charts with information related to the SaaS applications in your organization. These charts adjust to reflect any query applied to the page.
Click the Hide Charts icon  to hide the graphs in the Overview section. Click it again to display the charts.
-
Application Categories - Shows the number of SaaS applications per category (Sales, Security, Productivity, etc.). Hover over the various bars to see the percentage of applications for each category.
-
Affiliated Users per Application - Shows the number of affiliated users detected for each SaaS Application. Hover over the various bars to see the percentage of organization users for each application.
-
Application Risk - Shows the segmentation of the SaaS applications in your organization by risk level. Hover over the segments of the pie chart to see the number of applications represented by each segment. Select the checkboxes corresponding to the risk levels you want to display in this chart.

Views
You can display SaaS applications in a table that shows data for the applications in its various columns, or in a Tiles view that displays an individual tile for each application. The page opens displaying the default Table view. You can change to the Tiles view by selecting the Tiles icon ![]() .
.
To set the Tiles view as the default SaaS Applications view, select the option in Configuring User Interface Settings.
Tiles View
Application Tiles
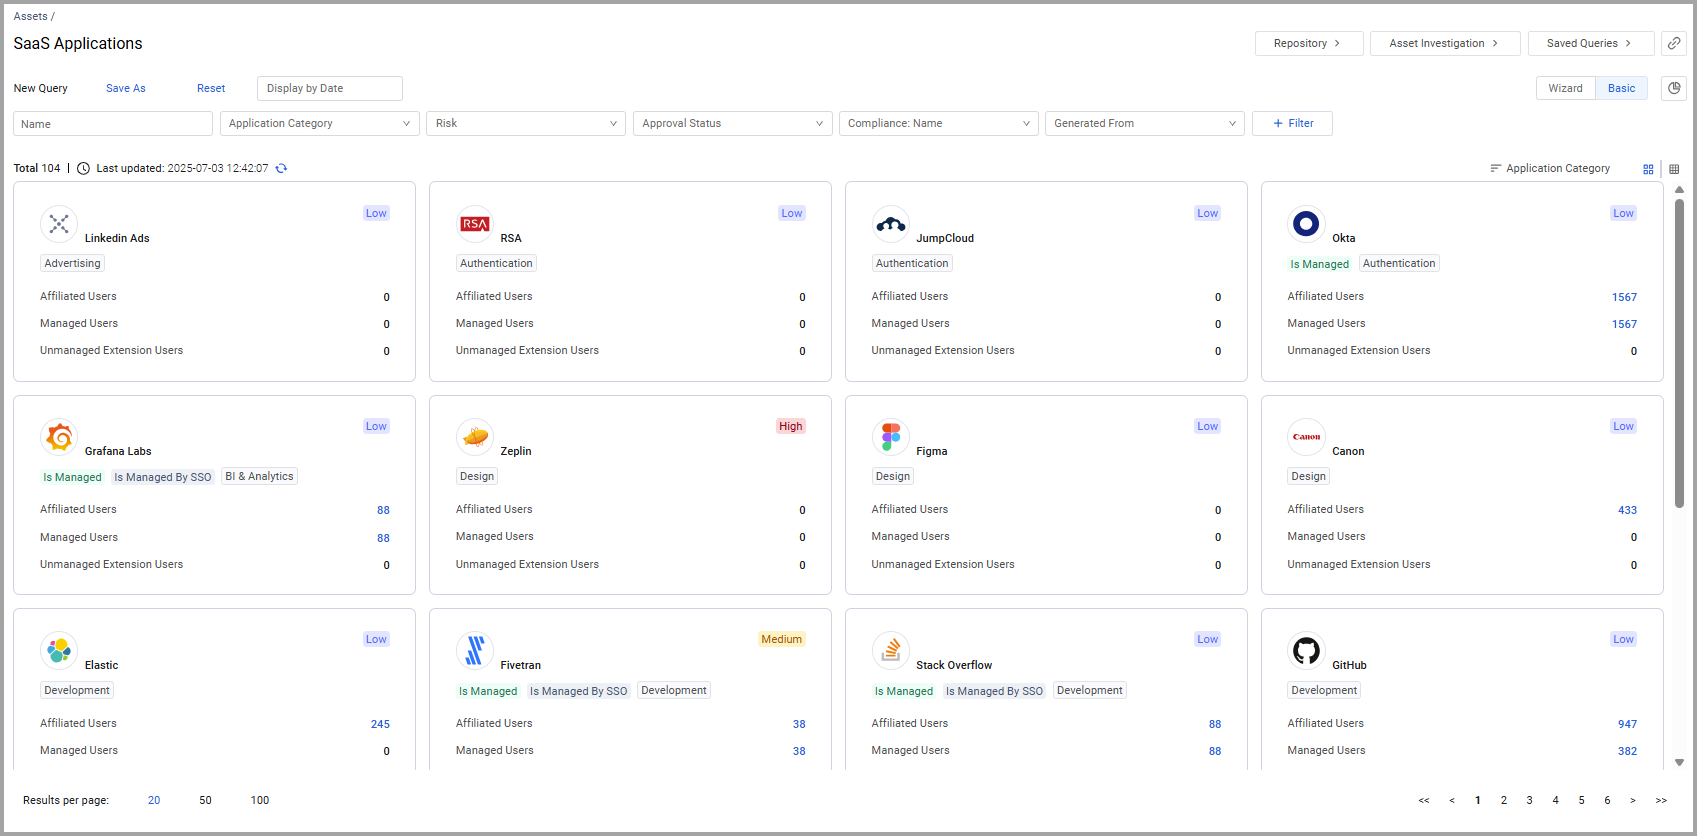
The Tiles view displays a tile for each SaaS application used in your organization that meets the defined filter criteria.
The Repository page contains similar tiles and pages for over 1800 SaaS applications that you can use to evaluate potential vendors.
Each card contains the following information:
- Risk level
- Tags indicating if and how the application is managed
- The number of users managed by SSO
- The number of users managed by the application
- The number of inactive users
You can click any of the numbers to view the list of users that it represents. For more information about these fields, see Enrichment Fields.
.png)
Sorting the Tiles
To change how the tiles are displayed:
- Open the Sort By drop-down.
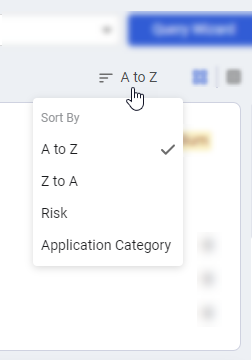
- Select to sort the tiles alphabetically from A to Z, Z to A, Risk, or Application Category.
Table View
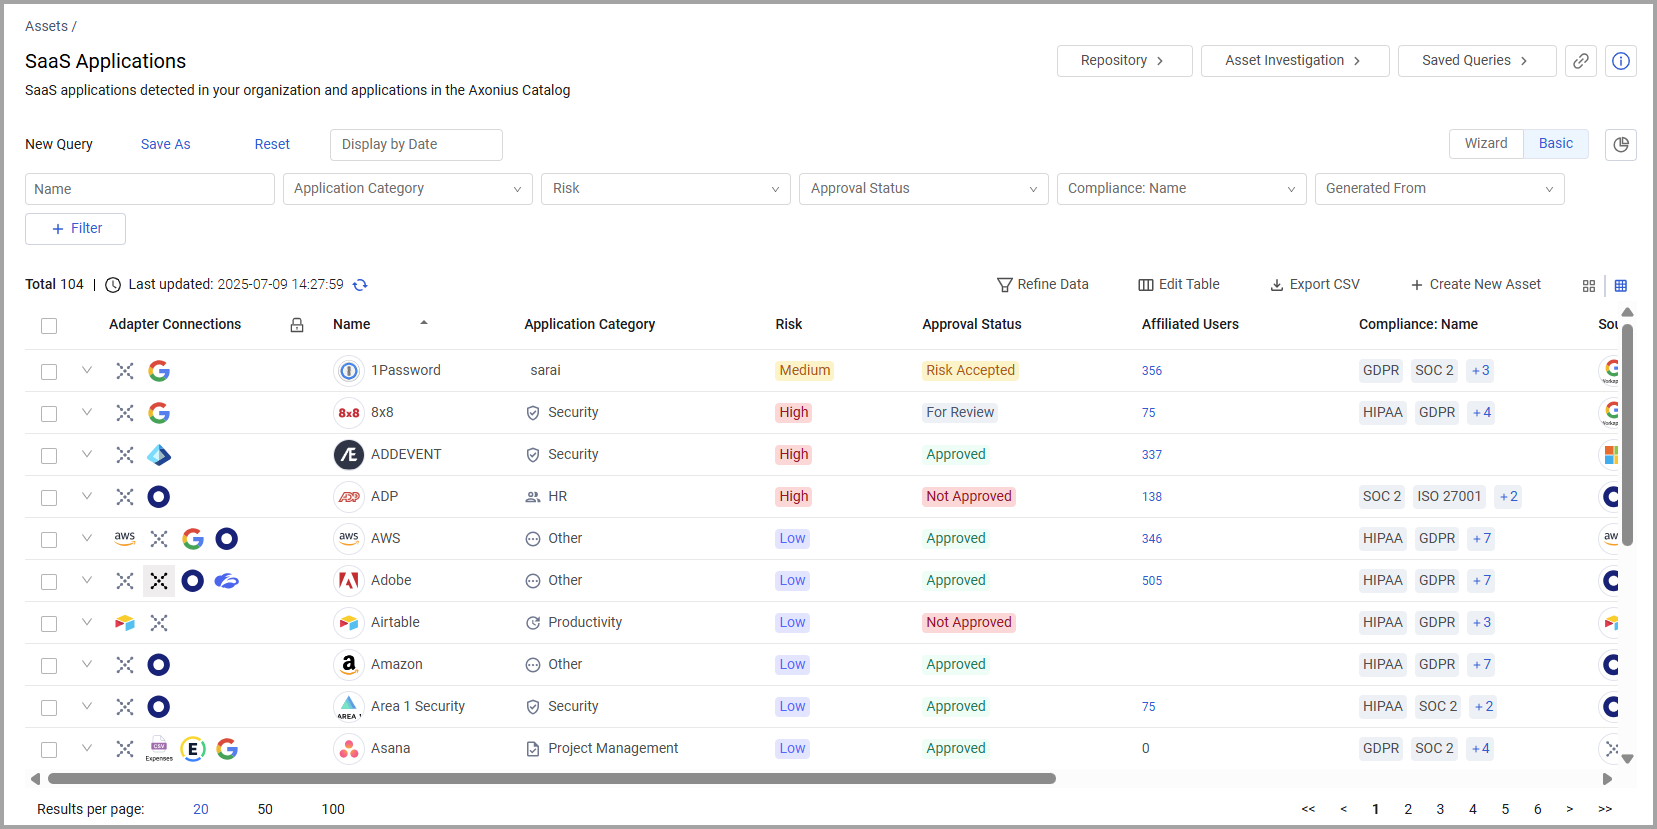
Each row in the Table view represents an individual SaaS application. Not all of the fields are displayed by default. Use Edit Columns to add or remove columns. Each user can customize what fields appear in their own, personalized default view. For more information, see Setting Page Columns Displays.
Click the arrow next to any of the fields to see more details about that field.
Adapter Connections
The Adapter Connections column displays the icons of the adapter connections from which this SaaS Application was seen or the source from which Axonius draws the data for any of the displayed applications.
- Axonius Catalog - A repository of SaaS applications that you can use to evaluate potential vendors. This connection includes all data from the catalog. You can use the aggregated adapter to query all of the fields from the Axonius Catalog (such as SSO, security, policies, and more) to display applications that meet your selected criteria.
- Axonius Discovery- Axonius leverages its device inventory to discover SaaS application usage per device.
- Axonius adapter - The Axonius adapter connection.
- CSV Adapter - Application data manually uploaded to Axonius from a CSV file. For more information, see CSV - Applications.
Application Fields
You can view and query many fields on the SaaS Applications page. These fields include the following categories:
Static Fields
These fields display static data about the application. This data is not subject to change across different user accounts. Some examples of these fields include:
-
Name- Name of the application.
-
Category - The industry category that defines the application type.
-
Risk -An assessment of the application's potential security risks (Low, Medium, or High). For more information, see Application Risk Level.
-
Compliance - The security standards that are relevant for this application, based on information provided by the application's vendor. Hover over the number to see all the relevant standards.
-
Approval Status - Indicates the approval status of a SaaS Application. See Approval Status for more details.
-
Recommendations - A complex field that displays insights to help users resolve potential issues related to applications. The complex field contains the following sub fields: includes the following fields for each relevant SaaS Application:
- Name - Category to describe the insight (for example: Unmanaged Extension Users of an unmanaged application).
- Type - The type of entity affected by this application issue.
- Severity - Indication if the issue represents a high, medium, or low level security threat.
- Description - A description of the insight about the application.
- Quantity - Number of application entities affected by this issue.
- Remediation - Steps to be taken to resolve this issue.
-
Multi Factor Authentication - Indicates if the application uses MFA for sign-in.
-
SSO Supported - Indicates if the application is an SSO application.
-
Preferred Category - Displays a single application category, even for applications with multiple categories. For Apps fetched by Zscaler, the field prefers the Axonius SaaS Repository category value.
-
Owner - The application's owner who is responsible for the application with in your organization. When this value is empty, you can manually add an owner using the Edit functionality.
- To do this, first add the Owner to the table, using Edit Table.
- Hover over a row, a Pencil icon is displayed.
- Click the icon and from the dialog that appears, edit the Owner value.
-
Bitsight Security Rating - A complex field that includes the following fields for each relevant SaaS Application:
- Security Rating - Bitsight's numeric rating for the application from 250 - 900.
- Risk - The corresponding risk assigned to the application based on the security rating. Values include High (250-630), Medium (640-730), and Low (740-900). For more information, see What is a Bitsight Security Rating?
Approval Status
You can set approval status for the SaaS Applications on your system. The default approval status is For Review. Use edit to change the values. Each Approval Status is displayed in a different color.
- Hover over an approval status, the edit icon is displayed.
- Click the edit icon, the Edit Approval Status drop-down opens.
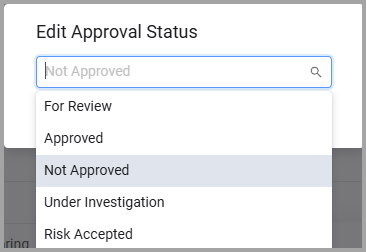
- Select the approval status you want. You can choose from
-
For Review - The initial default value of applications. The organization needs to review the application and set a status.
-
Approved - The application is approved for use in the organization.
-
Not Approved - The application is not approved for use in the organization.
-
Under Investigation - The meaning of this status is set by the organization. For example, this might be a new application that is being reviewed.
-
Risk Accepted - The meaning of this status is set by the organization. This might be an application that has some level of risk attached to it, but the organization accepts this level of risk.
-
Bulk Update of Approval Status
Use Custom fields to change the approval status for a number of applications in one go.
-
Select the applications you want.
-
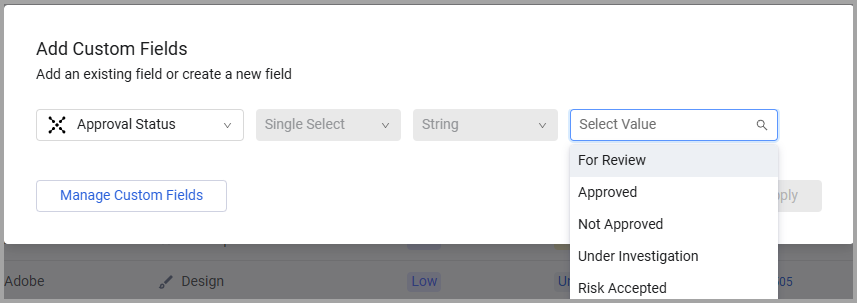
From the more actions menu (3-dot menu), choose Add Custom Field.
-
From Field choose Approval Status.

- From the Select Value drop-down, choose the Approval Status that you want to apply. The Approval Status is updated for these applications.
Enrichment Fields
Enrichment fields provide granular visibility into SaaS applications, user activities, and account-based expenditures. Populated by data fetched from the application, these fields display numerical query results, aggregated currency values, or boolean (True/False) parameters. Any field displaying a numerical value is interactive; clicking the value opens a list of the specific assets it represents.
Use these fields as indicators to prioritize investigation into your SaaS environment. For example, a high count in Total Misconfigured Settings can signal potential security risks, while elevated expense totals may highlight opportunities for cost optimization.
Dynamic Fields
Some examples of dynamic fields include:
- Associated Owner - Displays the value of the 'Username', 'Email, and 'User Department' fields from the Axonius User associated with the SaaS Application Owner.
- Is Discovered - Indicates if the application was discovered in your organization's SaaS environment (a subset of the SaaS Applications Repository).
- Is managed - Indicates if the application is managed (via Axonius adapter, SSO or both) or not managed at all.
- Is managed by Connected App - Indicates if the application is managed by its own adapter (for example: Zoom is managed by the Zoom adapter).
- Is managed by SSO - Indicates if the application is managed by the organization’s SSO solution.
- SSO Provider - Displays the logo of the application configured as the Single Sign-On (SSO) provider for accessing the SaaS application.
Generated From
The Generated From enrichment field indicates how a SaaS application was discovered (by its own connected adapter, from an installed software or a CVE on a device, an extension, a DNS record, an expense, or a license).
Permission Fields
The permission-related enrichment fields include:
- Excessive Write Permissions - The application's user extensions with Write permissions.
- Excessive Read Permissions - The application's user extensions with Read permissions.
Counter Fields
The counter fields display the number of users that meet the criteria defined for that field. You can click on the number to open the list of assets that the number represents on the relevant asset page, with the query automatically populated in the Query Wizard.
Some examples of these enrichment fields include:
-
Affiliated Users - All users for the application. These users are retrieved using the application's adapter, extensions used by the application, or DNS records that connect the users to the application.
-
Direct Adapter Users - Users fetched from the same application's adapter.
-
Managed Operational Active Users - Users who have logged into the application in the past number of days defined in the System Settings.
-
Managed Operational Inactive Users - Users who have not logged into the application in the past number of days defined in the System Settings.
-
SSO Users - Users that are managed by the organization’s SSO (user extensions fetched from the SSO adapter, and their extension type is “SSO").
-
Direct Operational Not SSO - Users who have been off-boarded from the SSO (removed, suspended, or deleted) but are still managed by the application.
-
SSO Not Direct Users - Users that are managed in the organization's SSO solution, but not directly in the application.
-
Last enrichment run - The date of the last enrichment on this application.
-
Suspended Users - The number of suspended users for this application.
-
Expense Amount - The total aggregated expenses cost for this application for the current calendar year.
-
License Cost - The total aggregated cost of licenses (active and inactive) for this application for the current calendar year.
-
External Users - The number of external users for this application.
-
User Extensions Used by App - The number of users that have extensions used by this application.
-
Upcoming renewals - The number of licenses for this application that are set to be renewed in the next 90 days.
-
Total Misconfigured Settings - The number of settings defined as misconfigured for this application.
-
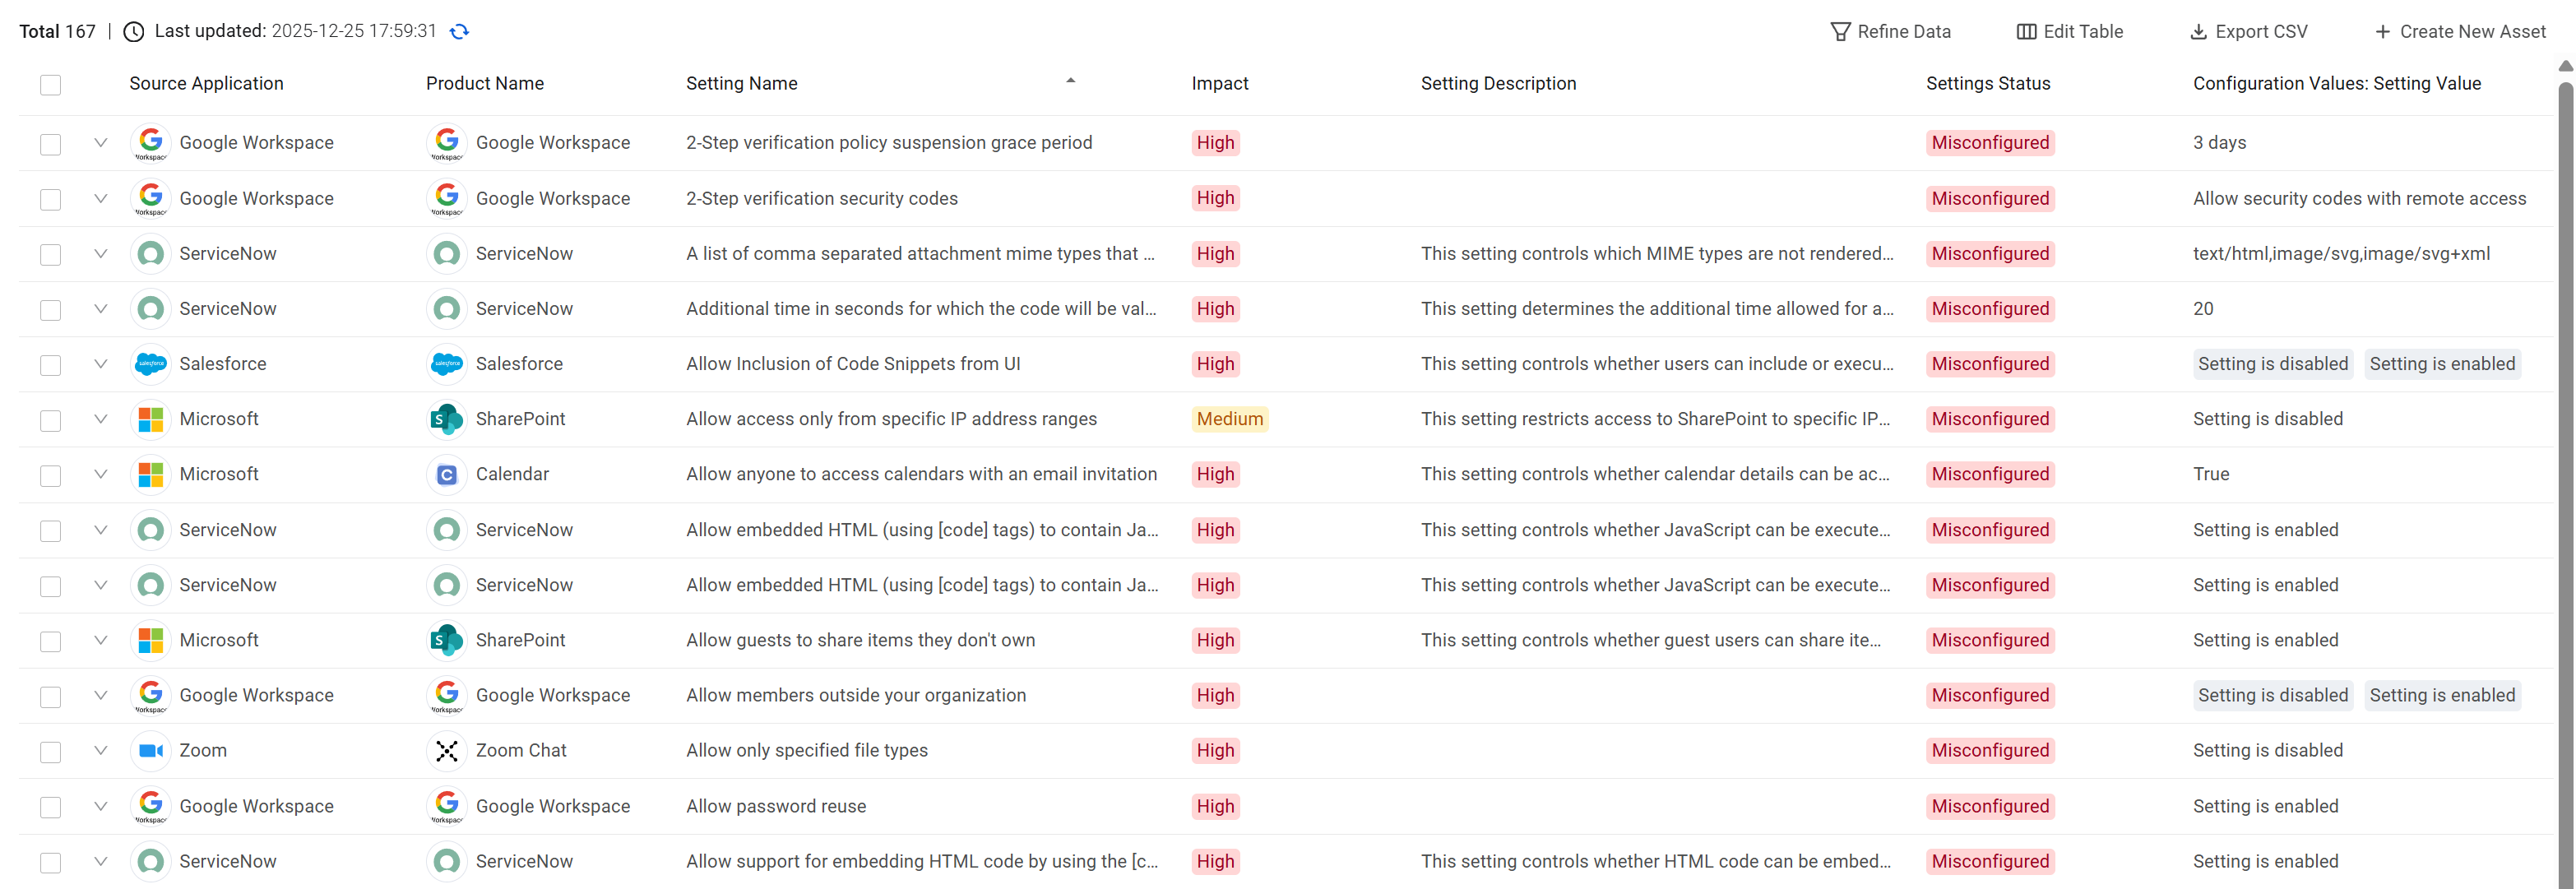
Total Medium Impact Misconfigured Settings - The number of security settings for an application or account that are currently misconfigured and categorized as having a Medium impact on security. Clicking the value redirects you to the Application Settings asset page, filtered by the application name, Medium impact level, and Misconfigured status.
-
Total High Impact Misconfigured Settings - The number of security settings for an application or account that are currently misconfigured and categorized as having a High impact on security. Clicking the value redirects you to the Application Settings asset page, filtered by the application name, High impact level, and Misconfigured status.
Note
The Total Medium Impact Misconfigured Settings and Total High Impact Misconfigured Settings fields are available at both the Application and Account levels. When accessed from an Account-level asset, the resulting query on the Application Settings page is further refined to show only settings associated with that specific account.
-
Total Accounts - The number of separately managed instances of this application.
-
License Status - The status of a license. Status can be:
- Active Licenses - The SaaS Application has at least one associated license where 'Is Active License' is
Yes. - Inactive Licenses The SaaS Application has associated licenses, but all of them have 'Is Active License' set to
No. - No Licenses - The SaaS Application has no associated licenses. When you select a value in the Active/Inactive Licenses column, you can navigate to the licenses page filtered by your selection.
- Active Licenses - The SaaS Application has at least one associated license where 'Is Active License' is
How Axonius Discovers SaaS Assets
Axonius discovers SaaS Applications in several ways. It populates the Generated From field to indicate the source of the discovery. Axonius Discovery runs in the Post-Correlation stage of the discovery cycle and populates the Generated From field. This helps you understand how a SaaS application was identified in your environment.
The Generated From field is populated based on the following methods. A SaaS application can be discovered by more than one source, for instance Slack can be discovered by Okta, Zscaler (DNS) and installed software from an EDR such as Crowdstrike.
DNS Discovery
When an adapter like Zscaler Web Security, Netskope, Cisco Meraki, Cisco Umbrella, or Microsoft Cloud App Security (MCAS) identifies a SaaS application through its DNS traffic, the ‘Generated From’ field displays DNS Discovery. This method infers the use of a SaaS application based on DNS queries made by devices in the network.
Admin Managed Extensions
For Identity Providers (IDPs) such as Google Workspace or MS Entra, the ‘Generated From’ field will show Admin Managed Extensions if the discovery is based on the following extension types Admin Consent, IDP, or Bookmark. This signifies that the application's presence is managed and approved by an administrator within the IDP.
SSO Extensions
If a SaaS application is discovered through a Single Sign-On (SSO) provider like Okta, Google Workspace, or MS Entra, the ‘Generated From’ field is populated with SSO Extensions. This indicates that the application is integrated with the organization's SSO infrastructure.
Non-Admin Managed Extensions
When IDPs like Google Workspace or MS Entra discover a SaaS application via the following extension types User Consent, ASP, Key, or Plugin, the ‘Generated From’ field displays Non-Admin Managed Extensions. This usually means the application was added by a user without explicit admin approval. For example, if a user used their corporate credentials to provide access to a third party application via their IDP.
Licenses
When the discovery is based on license information, the ‘Generated From’ field shows Licenses. This method identifies SaaS applications that have been licensed by the organization, often through integration with licensing management tools.
Installed Software
The "Generated From" field will display Installed Software when an endpoint management tool or an adapter with software inventory capabilities (e.g., Tanium Interact, Ivanti, or ManageEngine Endpoint (Desktop) Central and Patch Manager Plus) finds a "hint" of a SaaS application. A common example is the discovery of the Zoom client installed on a device, which would mean that the user also uses Zoom as a SaaS Application.
The Axonius discovery process correlates this installed software with the Axonius SaaS application catalog. The ‘Source Application’ field then specifies the adapter that found the installed software. This correlation confirms that the device likely uses the corresponding SaaS application.
Accessing the SaaS Applications Repository
The SaaS Application Repository page contains data and pages for a myriad of SaaS applications that you can use to evaluate potential vendors. This includes general information about these applications and their vendors and is not limited to applications that are used in your organization.
To open the SaaS Applications Repository, click Repository.

Creating Queries on SaaS Applications
You can create queries on this page using the Query Wizard or the Basic Query and query fields such as the fetch time, adapter connections, or Single Sign On. You can add additional levels to the query, such as querying by risk and security policy. Use these queries to find out which applications exist with asset context in your environment or how many applications have a particular risk score. Refer to Creating Queries with the Queries Wizard and how to create Queries in Basic mode to learn more about creating queries.
For example, this query enables you to determine how many high-risk applications were discovered in your SaaS environment:

After running the query, the overview and table show the queried applications, filtered by the criteria you defined in your query.
Adding Custom Data to an Application
You can add custom fields to one or more SaaS Application assets at the same time. You can use this to add and manage your own organization-specific data. For example, for an application your organization uses, you may want to add an Owner, Business Critical Designation, Custom Risk Evaluation, or other data points that you can edit for an application.
Select one or more applications and from the Actions menu choose Add Custom Fields.

Refer to Working with Custom Data to learn about adding custom fields.
Adding Tags to SaaS Applications
Use tags to assign context to your assets for granular filters and queries. Apply new or existing tags to the selected applications. The list of selected tags is applied to all selected applications.
Refer to Working with Tags to learn about adding tags to applications.
Viewing an Application Profile
You can click on an individual application asset to see all the data for that particular application. For more information, see Asset Profile Page.
For general information about working with tables, refer to Working with Tables.
Updated about 1 month ago
