Dashboards Page
The Dashboards page consists of individual dashboards that include one or more charts.
Use dashboards to see a visual representation of data from your environment. Each chart is based on one or more saved queries and gives you immediate insights about your environment. It provides a single, consolidated, and central area to monitor and absorb insights on all assets. Dashboards are designed to shed light on desired policy, breach of policy, and any other questions regarding asset management. Dashboards and charts can also be filtered to drill down to the details you want to see.
Use the default Axonius charts or create custom charts to build dashboards that meet your specific needs. Use dashboard templates to get a quick start with common charts and queries. You can also import dashboards created by other users.
The Dashboard page opens by default every time you log in to Axonius. You can also click ![]() on the left navigation panel.
on the left navigation panel.
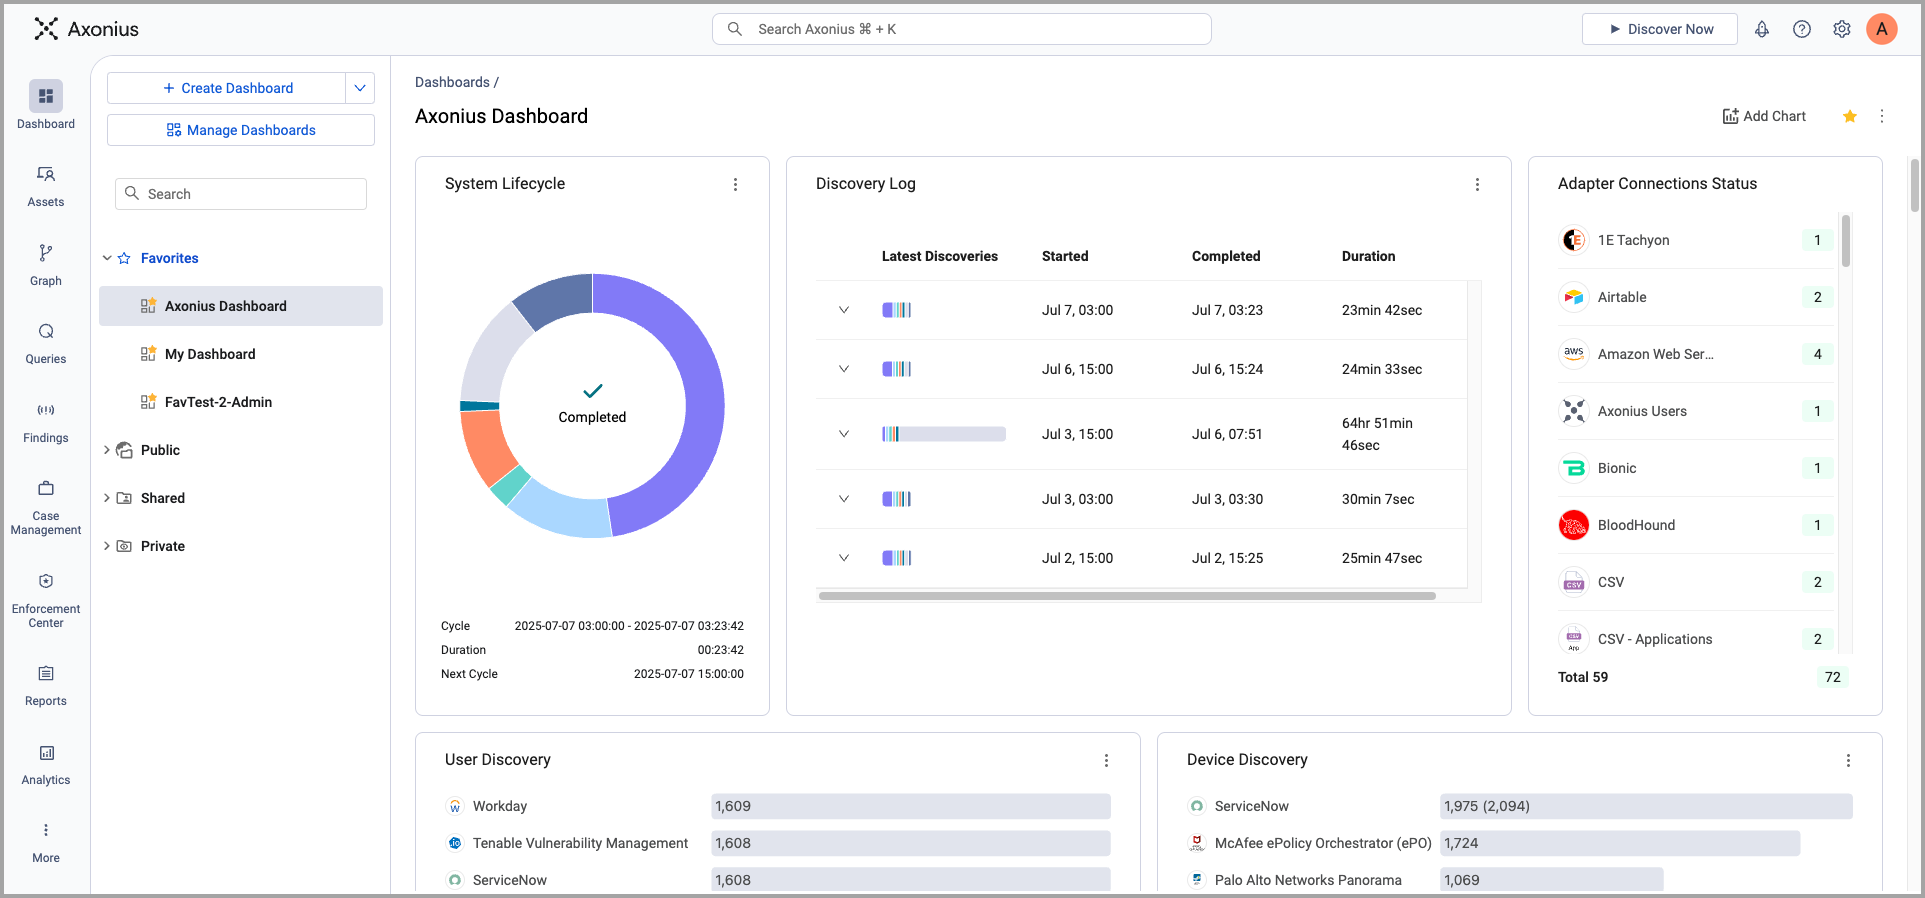
The Dashboard page consists of the folder pane on the left where you select the dashboard you want to view and, on the right, the charts of the selected dashboard. If no data has been collected, the dashboard is empty, waiting for the initial data to be collected.
Each chart includes either a visual/graph capturing the graphical insights or data in a table view. If no data has been collected, the charts are empty waiting for the initial data to be collected.
To hide the folder pane, click the arrow to collapse the pane.
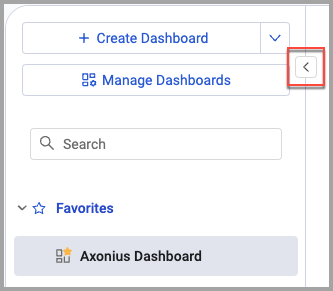
Click the arrow again to expand the pane.
To temporarily display the folder pane when it is closed, hover over the left band of the dashboard. The pane will open on top of the selected dashboard.
Dashboards are organized under the following main folders according to access permissions:
- Favorites - Lists all dashboards starred as Favorite.
- Public - Lists all dashboards accessible to all users in your Data Scope. Dashboards you create are available only to this Data Scope. This folder includes the Axonius default dashboards.
- Shared - Lists all dashboards shared across all Data Scopes. You must have the Add or Edit for all data scopes permission to edit dashboards in this folder.
- Private - Lists dashboards accessible only to you.
Subfolders can be created under the Public, Shared, and Private folders. See Managing Dashboards for more details about creating subfolders, arranging dashboards and other management tasks. The arrangement of folders and dashboards set in Dashboard Manager appears here in the folder pane.
Note
Users with the Admin role always have access to all dashboards (which are not private).
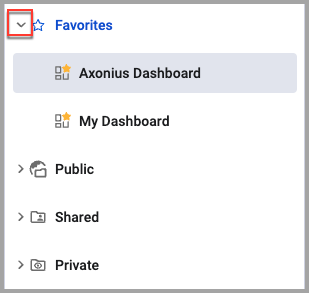
Folders can be expanded and collapsed by clicking the arrows next to the folder name. The folder that contains the currently selected dashboard is highlighted.
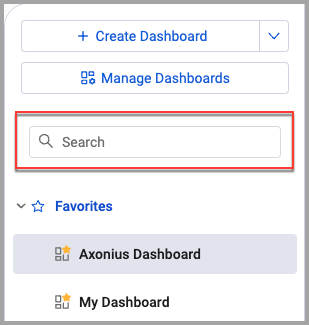
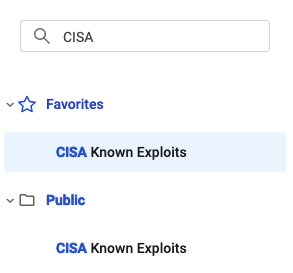
To search for a specific dashboard, start typing in the Search bar at the top of the pane. Matching results are shown immediately.
Resizing Dashboard Charts
You can resize any dashboard chart. Charts also resize automatically in response to changes in the browser window size.
To resize the chart
- Hover over the bottom-right corner of the chart until the resizing handle appears.
- Click the handle and drag the corner until the chart is the desired size.
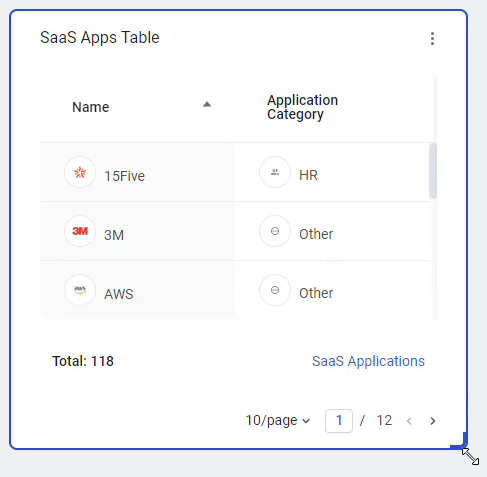
- Select the chart size you want. The chart is now displayed in the new resolution.
For example, you can resize a matrix table to show more values.
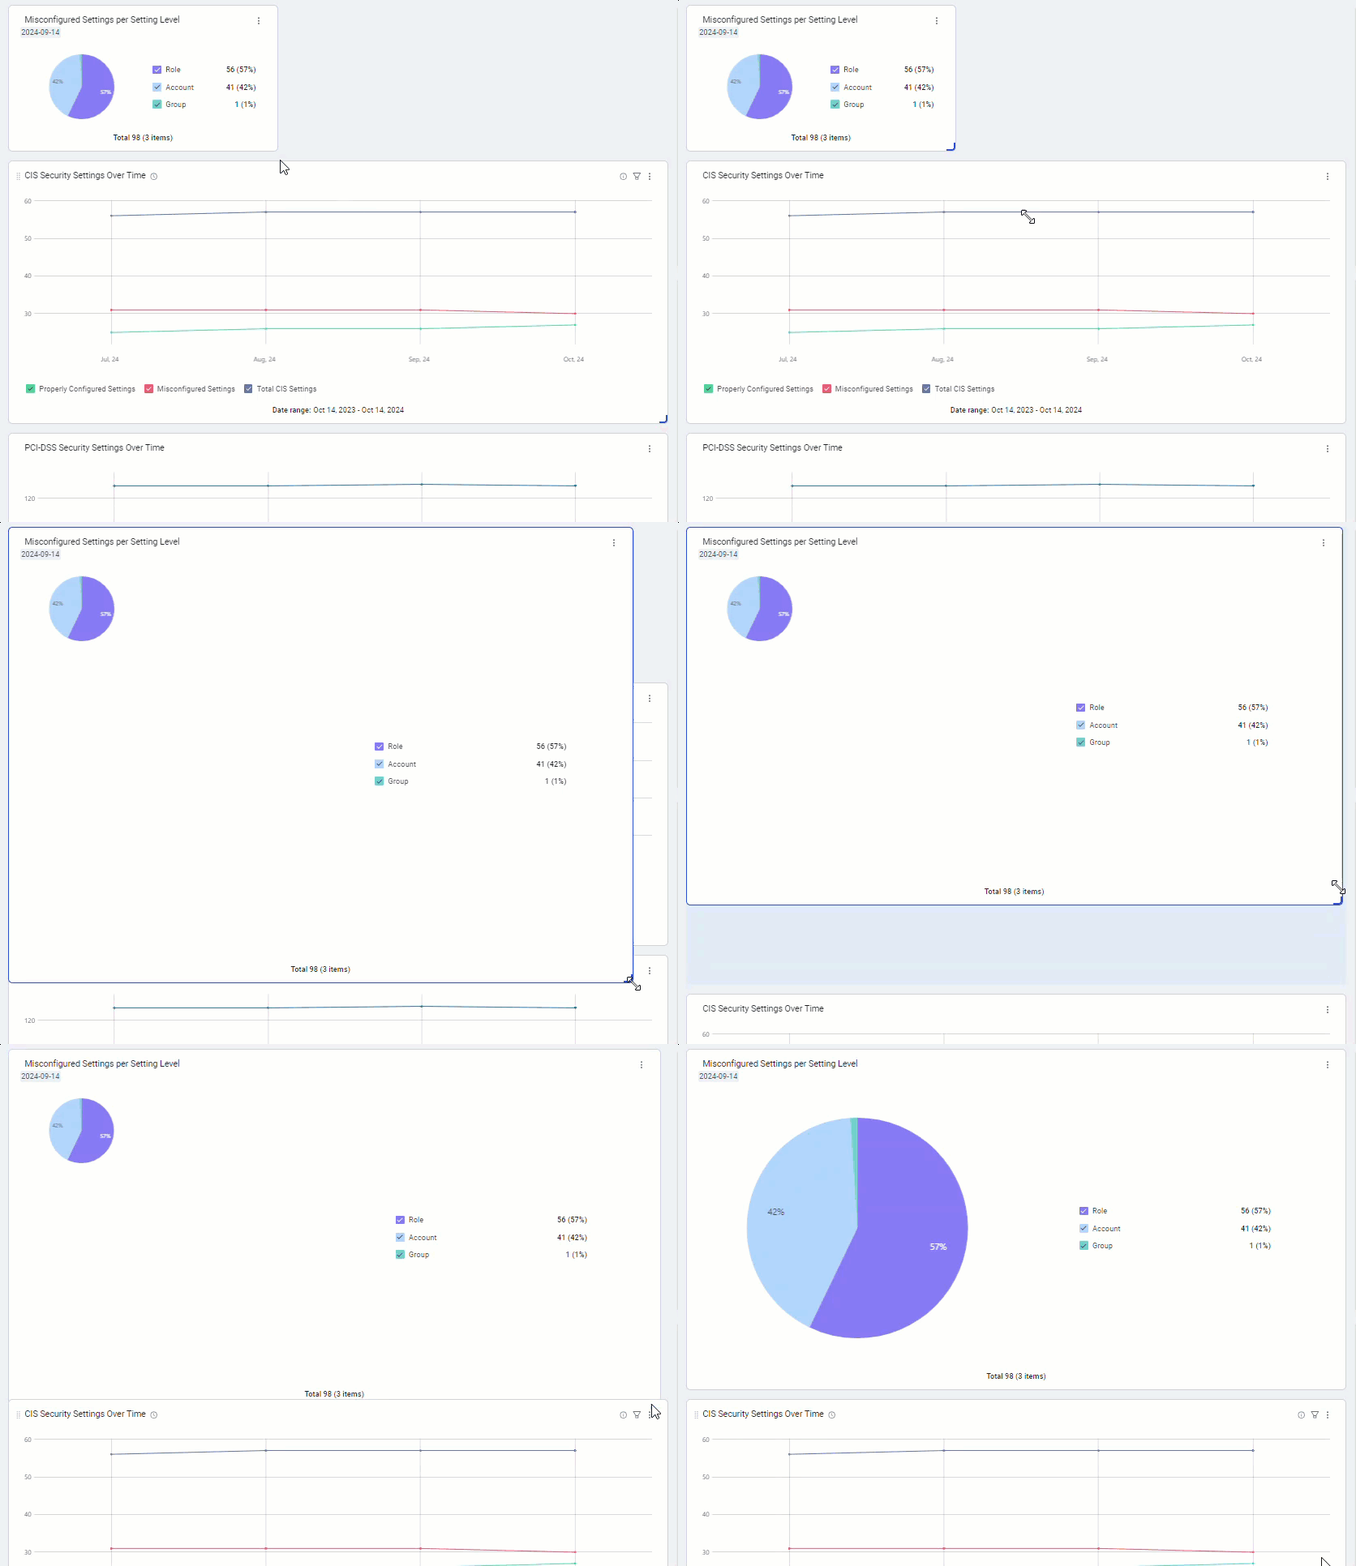
Once you resize a chart, it is displayed this way in reports as well. In this way, charts are displayed clearly in reports.
Setting Favorites in the Dashboards Page
Mark a dashboard as a favorite to add it to the Favorites folder. This makes it easy to find the dashboards you use the most. Both regular users and Admins can mark dashboards as favorites. To set favorites for all users, set them in the data scope defaults. Dashboards you mark as favorites also appear in the Favorites folder, but are only applied to your account and don't affect the favorites of any other user.
You can drag'n drop dashboards to rearrange them within the Favorites folder. Dashboards are sorted alphabetically within the other folders.
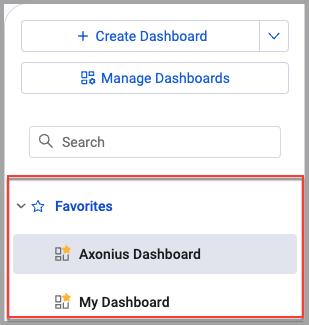
To add a dashboard to Favorites:
- Do one of the following:
- Click the 3-dot more menu next to the dashboard name and select Add to Favorites.
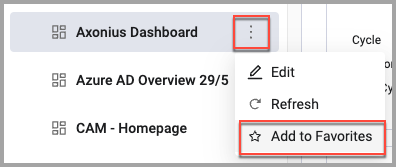
- With the dashboard displayed, click the star over the right top corner of it.

- The dashboard is added to the Favorites list. Favorite dashboards still appear in their original folder as well as in the Favorites folder.
Default Dashboards
Axonius includes two default dashboards:
-
My Dashboard - An editable dashboard you can set up to show the data you want to see. Visible only to you. You can add any charts to customize this dashboard. See Working with Custom Charts to learn more about adding and using custom charts. This dashboard cannot be exported.
-
Axonius Dashboard (displayed by default) - The Axonius Dashboard is displayed by default for new users. It displays basic information about assets in your environment and other system information, such as Adapters Fetch History. Once a user configures Favorites, the first dashboard in the Favorites folder is displayed upon logging in to Axonius. An Admin user or a user with the Add and edit dashboards permission, can configure the system to not display the Axonius Dashboard. See System Charts for more about the default charts included on this dashboard. Once data is collected, the default Axonius Dashboard appears, displaying these default system charts:
You can add new charts to each dashboard, add additional dashboards for your needs, and rename and delete existing ones.
For more details, see Working with Custom Charts.
Creating a New Dashboard
You can add additional dashboards that include charts to display the data about your environment you want to see.
To create a dashboard using one of the included templates, see Using Dashboard Templates.
To create a new dashboard:
- In the upper-right corner of the Dashboard page, click Add Dashboard.
- In Dashboard name, enter a descriptive name for the dashboard.
- In Description, add an optional description about the dashboard.
- In Who has access, configure the access privileges for the query.
- In Folder, select the folder where the new query will be saved. Depending on the access configuration, the folder may be selected automatically.
- Click Save. The dashboard is created, added to the appropriate folder according to the access permissions you selected, and displayed.
- Add Custom Charts to your dashboard.
Editing an Existing Dashboard
You can edit an existing dashboard.
Notes
A shared dashboard can only be edited in the Global Data Scope.
In the case where a Role is assigned a non-Gobal Data Scope and has been assigned Editor access on a shared dashboard, users with that Role still won't be able to edit the shared Dashboard.
When you change access permissions, the Dashboard is moved to the folder appropriate for the new permissions.
To edit an existing dashboard:
- Select the dashboard you want to edit.
- From the 3-dot menu above the upper right corner of the dashboard, select Edit.
- Change the dashboard name and/or access permissions. See Changing Dashboard Access Permissions for detailed instructions about changing permissions.
- Click Save.
Note
When you change access permissions, the dashboard is moved to the folder appropriate for the new permissions.
See Performing Actions on Dashboards for more options.
Adding a Custom Chart to a Dashboard
See Working with Custom Charts on how to add and configure the different chart types.
Refreshing Dashboard Data
You can refresh all of the data on all the charts on a dashboard. This is useful if a fetch has occurred since the dashboard was created or last refreshed.
To refresh the charts on a dashboard:
-
Select the dashboard you want to refresh.
-
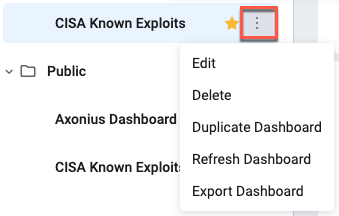
From the 3-dot menu next to the dashboard name in the folders pane or above the upper right corner of the dashboard, click the 3-dot menu and then Refresh Dashboard.
-
A message appears asking if you want to do this. Click Yes to proceed.
The system updates all of the charts in the current dashboard. Refreshing the dashboard might take a little while. A spinner icon shows that the update is taking place. While the dashboard is refreshing, you can continue to work with the existing data.
-
The time the chart was last updated appears in the metadata next to the dashboard name above the upper left corner of the Dashboard.
See Performing Actions on Dashboards.
For more about fetches, see Adapters Fetch History.
Duplicating a Dashboard
You can duplicate a dashboard and then modify it. This is useful when you want to create a new dashboard similar to an existing one. All charts in the dashboard will be duplicated.
To duplicate a dashboard:
-
Select the dashboard you want to duplicate.
-
From the 3-dot menu next to the dashboard name in the folders pane or above the upper right corner of the dashboard, select Duplicate.
.png)
-
The duplicate dashboard will appear to the right of the original.
- The name of the new dashboard will be in the format:
COPY - \<*original dashboard name*> - The copy will have the same access, roles and permissions as the original.
- All charts will be copied, including all settings as they are in the original maintaining the order of the charts, size, name, description, queries, etc.
- The copy can be edited independently, like any other dashboard. You can change the name, the queries, and any other item.
- The name of the new dashboard will be in the format:
Deleting Dashboards
Deleting a dashboard completely removes it from the system and cannot be undone.
To delete a single dashboard:
- Select the dashboard you want to delete.
- From the 3-dot menu next to the Dashboard name in the folders pane or above the upper right corner of the dashboard, select Delete.
- Confirm the delete action. The dashboard is removed from the system.
To delete multiple dashboards:
- On the Dashboard Manager page, select the dashboards you want to delete.
- From the Actions menu, select Delete.
- Confirm the delete action. The dashboards are removed from the system.
Exporting a Dashboard
You can export a dashboard for use in another Data Scope or Axonius instance. See Importing and Exporting Dashboards for more information.
Searching the Dashboard List
You can search for a specific dashboard.
To search for a dashboard:
-
Start entering the name of a dashboard or folder. The dashboards are instantly filtered and the entered text is highlighted blue.
Filtering Dashboards and Charts
You can add a persistent filter to a dashboard that applies to all charts and a non-persistent filter to an individual chart. See:
Updated 24 days ago
