Viewing Enforcement Set Run History
On the Run History page, you can view the results of all runs of Enforcement Sets defined in Axonius or of a single Enforcement Set.
Viewing the Run History of All Enforcement Sets
From the Enforcements page, you can open the Run History page of all Enforcement Sets, in the same tab or in a new tab. When you open it in the same tab, you can use the Back arrow to return to the Enforcements page.
To view the run history of all Enforcement Sets
- In the same tab: In the upper-right corner of the Enforcements page, click Run History. The Run History page opens in the same tab.

- In a new tab: In the upper-right corner of the Enforcements page, right-click Run History and click Open in new tab. The Run History page opens in a new tab on the right.

Viewing the Run History of a Simple Enforcement Set
To view the runs of a simple (one-action) Enforcement Set
- In the Enforcements table in the Enforcements page, click a one-action Enforcement Set.
- In the header of the Edit Enforcement Set drawer that opens, click the Run History icon. The Run History page opens, displaying the runs of the selected one-action Enforcement Set.

Viewing the Run History of a Complex Enforcement Set
To view the runs of a complex (multi-action) Enforcement Set
- In the Enforcements table in the Enforcements page, click a multi-action Enforcement Set.
- In The Enforcement Set's configuration summary page that opens, in the upper-right corner, click View Runs. The Run History - Enforcement Sets tab opens, displaying the runs of the selected multi-action Enforcement Set. The name of the selected Enforcement Name appears in the filter. You can select other Enforcement Sets from this dropdown to show their run history as well.

The Run History Page
The Run History page displays a list of runs of all Enforcement Sets or of a selected Enforcement Set and allows you to investigate the results of each run.

The Run History page consists of the following main elements:
- Search/Filter bar
- Run History table
- Total runs performed
- Export CSV button
Run History Table
The Run History table displays a list of Enforcement Set runs, with one row representing each run. You can expand a multi-action row in the Run History table to display one row per action and view information on each action. The Run History table includes the following fields, by default, for each Enforcement Set, and where relevant, for each Enforcement Action within the Enforcement Set:
- Actions - The icons indicate the type of actions configured in the Enforcement Set. You can click the Down arrow in front of a multi-action run to expand it to view information on each action in the run.
- Run - The ID number of the run. For each action, it shows the name of the Enforcement Action.
- Enforcement Name – The Enforcement Set name.
- Trigger Type - The type of trigger that caused the Enforcement Set to run:
- Scheduled - The Enforcement Set was run according to the schedule configured in the Enforcement Set. Learn more on scheduled Enforcement Set runs.
- Manual Run - The Enforcement Set was run manually. Learn more on manually run Enforcement Sets.
- Manual Test Run - The Enforcement Set was run on one asset when testing a newly created Enforcement Set. Learn more on how to test an Enforcement Set.
- Findings Rule - Enforcement Action from the Notify category was run to send an external notification on an alert that was triggered by a Findings Rule (provided the Findings Rule External Notification settings were configured with that Enforcement Action).
- Result - Shows the run results: Completed, Failed, In Progress, Partially, Pending, Delayed, or Terminated.
- Query Name – The saved query that determines on which assets the Enforcement Set is run.
- Start Time – The start date and time of the run.
- End Time – The end date and time of the run.
Note
When sorting the Run History by the End Time field in descending order, In Progress runs appear at the top, followed by all other runs sorted by their end times.
- Duration - The calculated total fetch duration in HH:MM:SS.ss format.
- Affected Assets - The total number of assets that match the query.
- Success – The number of assets on which the Enforcement Actions ran successfully.
- Failed - The number of assets on which the Enforcement Actions did not run successfully.
- Discovery Cycle - The identifier of the discovery cycle in which the activity occurred. This is presented as the start date and time of the discovery cycle.
Viewing Detailed Run Information and the Enforcement Set Configuration
In the Run History table, click any Enforcement Set run (row) to open the drawer with a tab for each of its Enforcement Actions. Clicking a tab shows detailed information about the Enforcement Action run, as well as its Action Conditions (Dynamic Values statement) and Configuration.
You can click the Action Center ![]() icon in the header of the Run drawer to open the detailed configuration of the Enforcement Set.
icon in the header of the Run drawer to open the detailed configuration of the Enforcement Set.
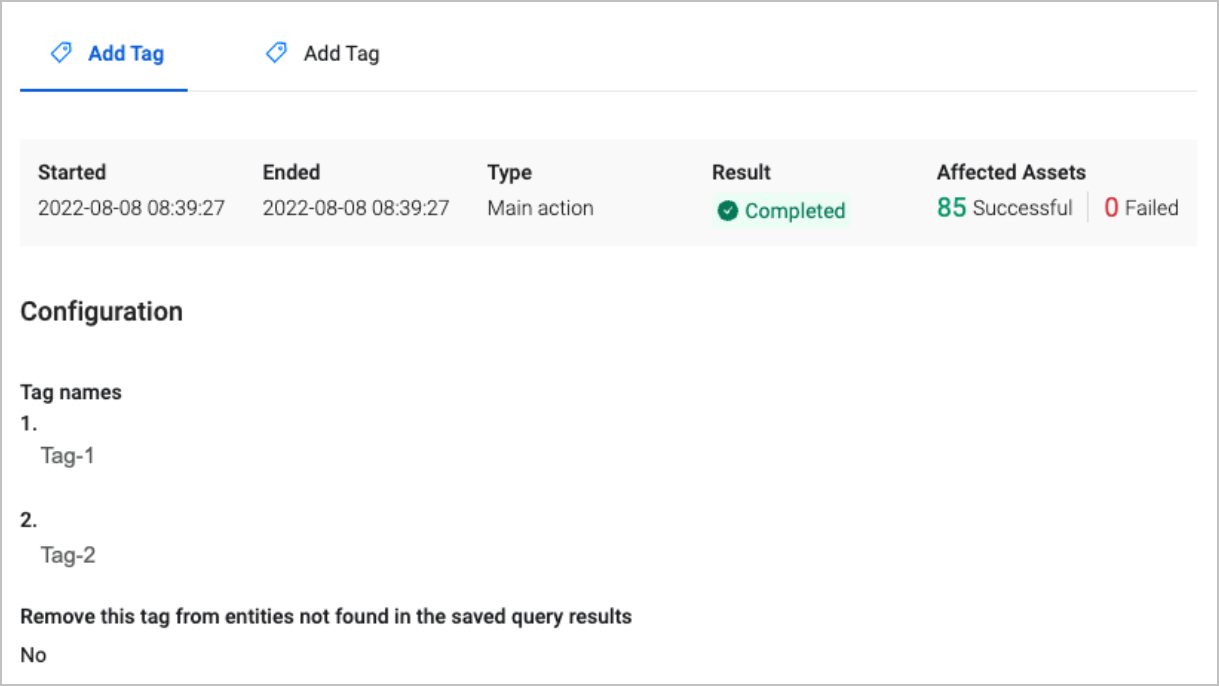
The following Run Drawer presents the run details and configuration of the main Enforcement Action in the Enforcement Set. You can click the other tab to present the other Enforcement Action's run details.
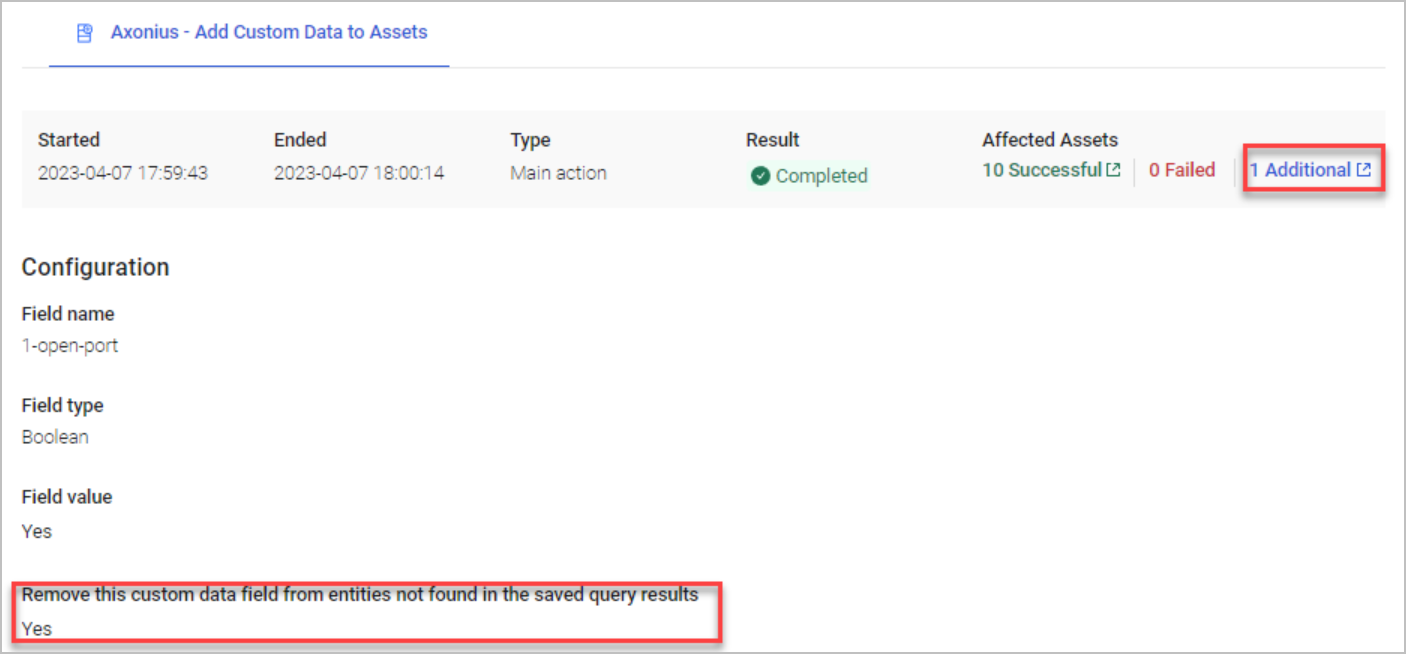
The following Run Drawer presents the run details of the single Enforcement Action in the Enforcement Set, and with an Additional count under Affected Assets.
At the top of each tab, the following information is shown:
- Started, Ended - Start and end date and time of the run.
- Type - Whether the selected Enforcement Action is the Main action, Success action, Failure action, or Post action.
- Result - Whether the run Completed successfully, Failed, is In Progress, Partially completed, is Pending, Delayed, or Terminated.
- Affected Assets - The number of assets affected by the run:
-
Successful -
- The number of assets on which the Enforcement Set ran successfully. Click the number link to pivot to the Assets page with a list of these assets. Under the EC: Result Details column is displayed
 .
. - Learn how the Manage Custom Enrichment - Enrich Assets with CSV File enforcement action determines to classify assets as Successful.
- The number of assets on which the Enforcement Set ran successfully. Click the number link to pivot to the Assets page with a list of these assets. Under the EC: Result Details column is displayed
-
Failed -
- The number of assets on which the Enforcement Set run failed. Click the number link to pivot to the Assets page with a list of these assets. Under the EC: Result Details column is displayed the beginning of the error message. Hovering over the field displays the full error message. For example,
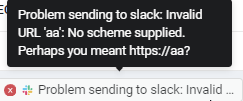 . Refer to
 - Learn how the Manage Custom Enrichment - Enrich Assets with CSV File enforcement action determines to classify assets as Failed.
- The number of assets on which the Enforcement Set run failed. Click the number link to pivot to the Assets page with a list of these assets. Under the EC: Result Details column is displayed the beginning of the error message. Hovering over the field displays the full error message. For example,
-
Additional -
- The number of assets on which other actions were performed, when Remove this tag from entities not found in the saved query results is selected on either Axonius - Add Custom Data to Assets or Axonius - Add and Remove Tag. Click the number to see a list of these assets.
- Learn how the Manage Custom Enrichment - Enrich Assets with CSV File enforcement action determines to classify assets as Additional.
-
Note
The number of Affected Assets (Successful, Failed, and Additional) is calculated at the end of a run. When some time after the run, you pivot from the Successful number link in the Run drawer to the Assets page, it could be that the number of reported Successful assets will be lower or higher than the actual number of assets on the Assets page. Similarly for Failed and Additional assets. This difference is due to assets constantly being correlated and deleted in the system over time. If you want to display on the Assets page all Successful, Failed, or Additional assets that existed at the time of the run, you can change Display by Date on the Assets page to the date of the run.
When an Enforcement Action runs one time on an entire pool (e.g., send a single email or create a single ticket for all assets returned from a query), if the action results in an error, the Run Error is displayed in the drawer.

When an Enforcement Action runs asset-by-asset (e.g., tag, custom data, ticket per asset), click the Failed link in the drawer to open the Assets page with the assets that failed in the run. (See EC Result Details in the first screen below) Clicking an individual failed asset from that page and opening its Enforcement Runs tab to view the detailed error in the Additional Info column (second screen below).


Note
You can also view detailed information about each Enforcement Action run (but not its Additional affected assets, and without the configuration summary) directly from the Run History table by expanding the Enforcement Set Run row (click the Down arrow to the left of the Actions column) to show its Enforcement Actions.
Viewing Run History of an Asset
In the Run Drawer, you can click the number of Success, Failed, or Additional assets to open the list of relevant assets. (You can also click the number of Success or Failed (but not Additional) assets in the Enforcement Action row on the Run History page to open the list of assets.) You can then click any asset record, and in the page that opens, click the Enforcement Runs tab to see the history of all enforcement runs on this asset. To learn more, see Asset Profile Page.
The errors that occurred on assets are displayed in the Failed assets breakdown section. Expand the section to see a list of errors. Click View Assets to open the assets page with a list of these assets.

Filtering the Run History Table
You can filter the Run History table by selecting from the following lists:
- Search runs - Free-text search on all text fields.
- Enforcement Name -Filters the list by Enforcement Set name.
- Action Name - Filters the list by the Enforcement Action and lists all Enforcement Sets that include that Enforcement Action.
- Result - Filters by the result of the Enforcement Action run:
- Completed - Shows all Enforcement Set runs that have finished.
- Failed - Shows all Enforcement Sets where all Actions failed.
- In Progress - Shows all Enforcement Sets that are still running.
- Delayed - Shows all Enforcement Sets where an action (post, success, or failure) is configured to run at a later time.
- Partially - Shows all Enforcement Sets where at least one action (but not all) failed.
- Pending - Shows all Enforcement Sets that are queued to run.
- Terminated - Shows a list of all Enforcement Sets whose run was terminated.
- Start time, End time - Filters by the date that the Enforcement Action was run.
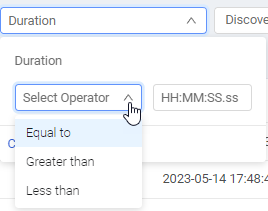
- Duration - From the dropdown, select an operator (Equal to, Greater than, or Less than) and enter the time duration (in HH:MM:SS.ss) format) that you want to filter.
- To set fractional seconds, highlight ss and enter a number up to 99.
- To set seconds, highlight SS and enter a number up to 59.
- To set minutes, highlight MM and enter a number up to 59.
- To set hours, highlight HH and enter a number up to 99.
Note
It can be very useful to filter the Run History table by Duration to view all the runs that were lengthier than expected. These "bad" runs can then be examined to check out if there is a problem, and if yes, attempt to resolve it.
- Discovery Cycle - Display only Enforcement Set runs from a specific Discovery Cycle, or Cycles.
The total number of Enforcement Set runs that match the search criteria is displayed on the top left side of the Run History table just under the Filter bar. When no search criteria is selected, the total results represent the total number of runs.

You can click the following to perform quick actions on filters:
- Select All - Selects all options in a specific filter.
- Clear All - Clears all selections in a specific filter.
- Reset - Clears all filters and displays the entire table.
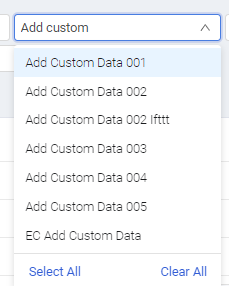
Filtering by Enforcement Set Name
In the Enforcement Name search box, type all or part of the Enforcement Set name, and then from the resulting list of Enforcement Sets containing the searched string, select the relevant Enforcement Set name.
Run History Retention
The Run History page always displays the last 100,000 runs.
Exporting Run History
You can export the Run History table data to a CSV file.
To export the run history to a CSV file:
- In the Run History page, on the right side above the table, click Export CSV.
The CSV file is automatically downloaded with a name format as:
enforcement_run_history_< date >< time >.csv
When you set a filter, only the filtered data is exported to the CSV file.
Enforcement Set Run History Actions
You can perform the following actions on one or more Enforcement Set runs on the Enforcement Sets Run History page:
Updated 2 months ago
