
Displaying Rule Alert Data in a Dashboard
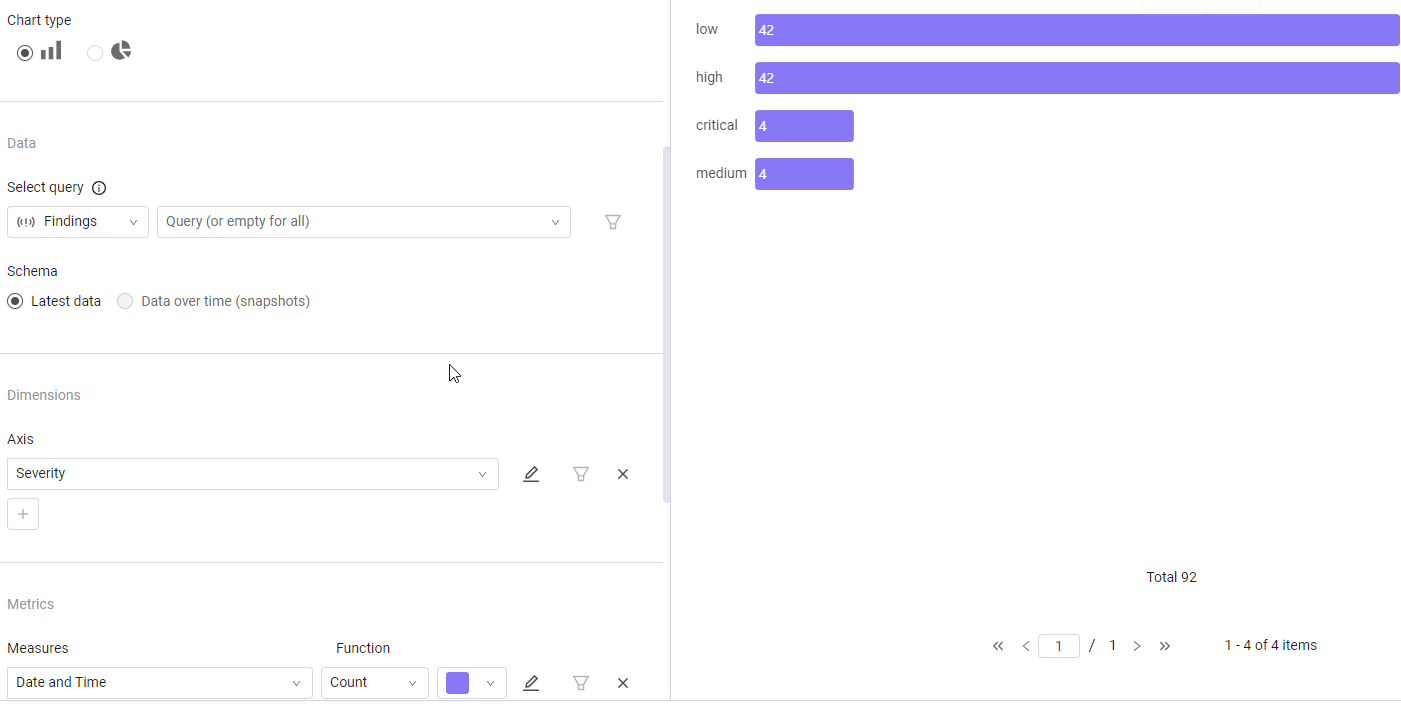
You can display rule alert data in the Dashboard with the Pivot Chart or the Field Segmentation chart. For example, you can display a segmentation of alert severity in your organization. If the chart shows that there's a high frequency of urgent alerts, that would indicate that there may be a systematic issue that needs to be dealt with.
Note
You cannot filter or open a rule alerts query in the Chart Wizard. Such queries can only be managed in the Findings module.
Updated 2 months ago
Did this page help you?